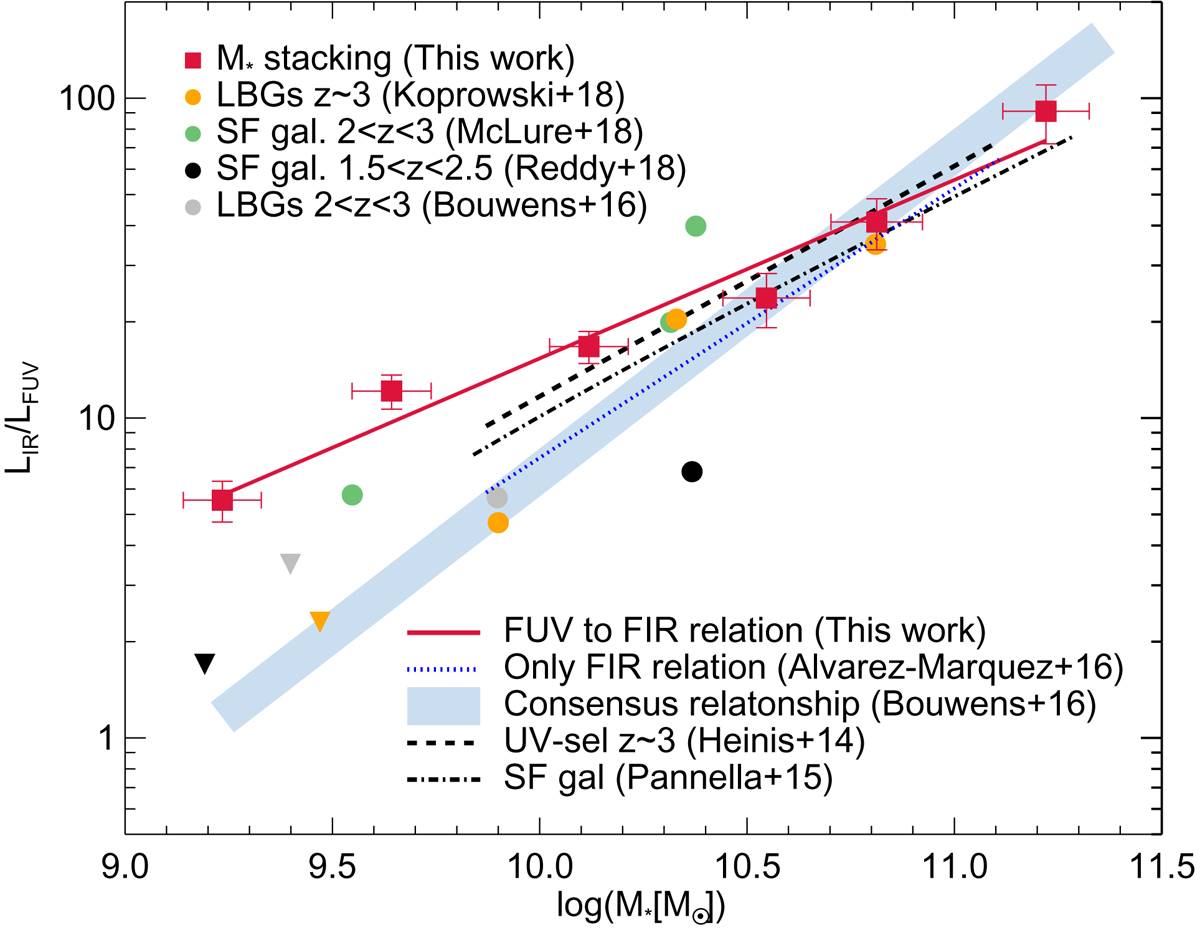
Fig. 6.
IRX–M* diagram. Our rest-frame FUV-to-FIR stacking analysis as a function of M* (LBG-M) results and the power-law fit are shown by red squares and solid line. The blue line presents the consensus relationship for star-forming galaxies at redshifts 2 < z < 3 (Bouwens et al. 2016), and defined by a combination of different works done in the literature (Reddy et al. 2010; Whitaker et al. 2014; Álvarez-Márquez et al. 2016). This relation includes that previously derived from a FIR stacking analysis over our LBG sample (AM16, dotted blue line). We overplot the relations obtained from a stacking analysis of UV-selected galaxies at redshift z ∼ 3 (Heinis et al. 2014, dashed line) and a complete sample of star-forming galaxies up to z ∼ 4 (Pannella et al. 2015, dot-dashed line). We also show the IRX–M* results from LBGs at redshifts, z ∼ 3 (Koprowski et al. 2018, orange dot) and 2 < z < 3 (Bouwens et al. 2016, gray dot), and star-forming galaxies at redshifts 2 < z < 3 (McLure et al. 2018, green dots) and 1.5 < z < 2.5 (Reddy et al. 2018, black dots). The downward triangles represent upper limits.
Current usage metrics show cumulative count of Article Views (full-text article views including HTML views, PDF and ePub downloads, according to the available data) and Abstracts Views on Vision4Press platform.
Data correspond to usage on the plateform after 2015. The current usage metrics is available 48-96 hours after online publication and is updated daily on week days.
Initial download of the metrics may take a while.