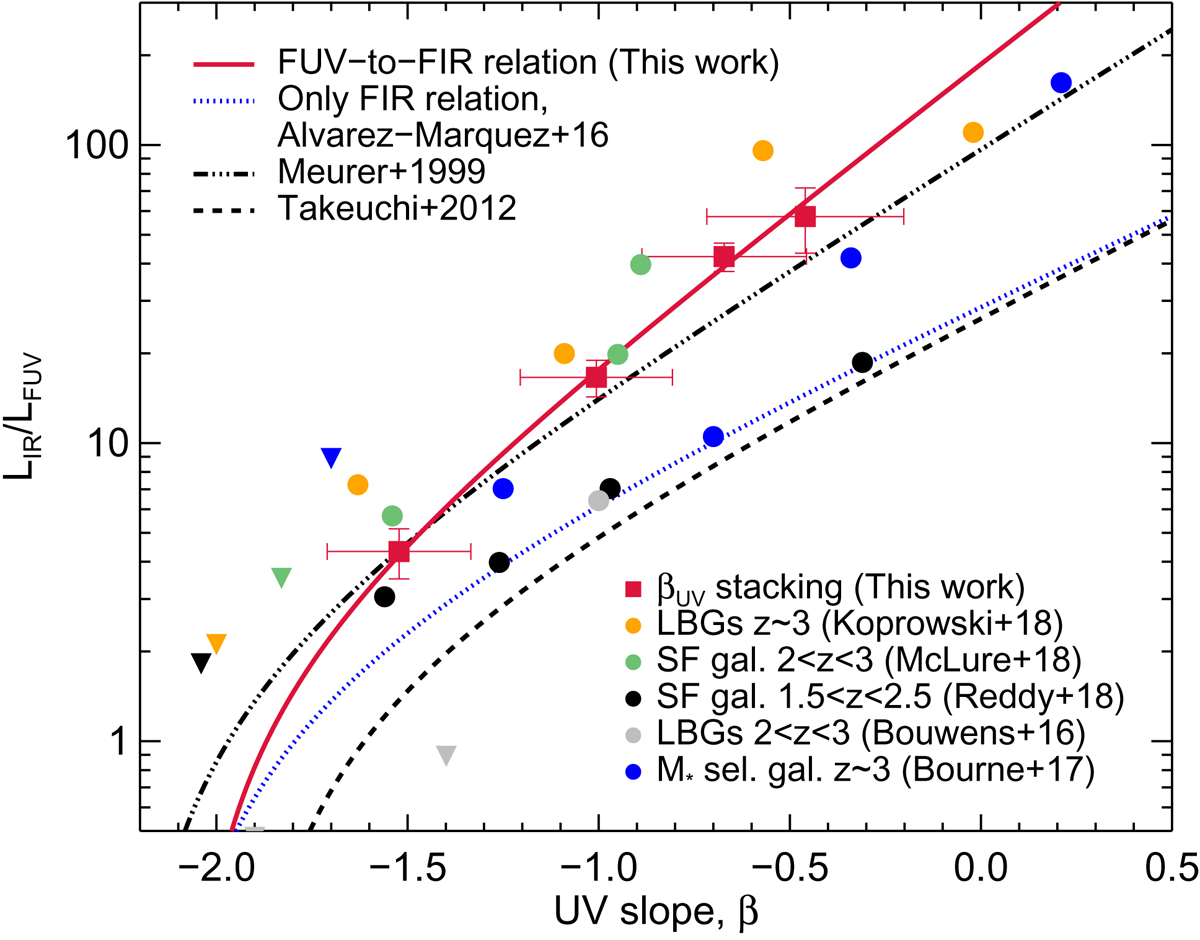
Fig. 5.
IRX–βUV diagram. Lines show different IRX–βUV relations: the well-known local starburst galaxies calibration (M99; triple-dot-dashed line), the aperture correction of M99 relation by Takeuchi et al. (2012; dashed line), and the relation derived from a FIR stacking analysis over the same LBG sample (AM16; dotted blue line). In addition, we plot the IRX–βUV results from LBGs at redshifts, z ∼ 3 (Koprowski et al. 2018, orange dots) and 2 < z < 3 (Bouwens et al. 2016, gray dots), star-forming galaxies at redshifts, 2 < z < 3 (McLure et al. 2018, green dots) and 1.5 < z < 2.5 (Reddy et al. 2018, black dots), and a mass selected sample at redshift z ∼ 3 (Bourne et al. 2017, blue dots). The downward triangles represent upper limits.
Current usage metrics show cumulative count of Article Views (full-text article views including HTML views, PDF and ePub downloads, according to the available data) and Abstracts Views on Vision4Press platform.
Data correspond to usage on the plateform after 2015. The current usage metrics is available 48-96 hours after online publication and is updated daily on week days.
Initial download of the metrics may take a while.