Fig. 2.
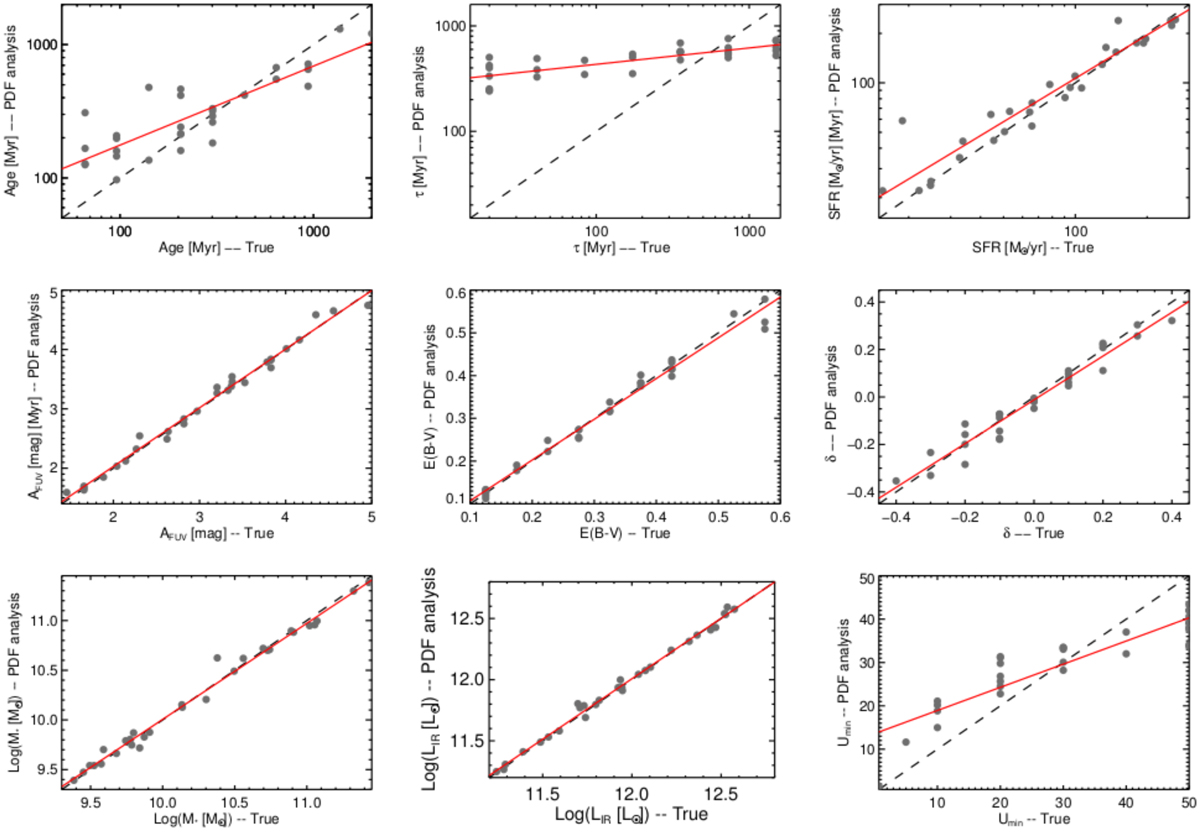
CIGALE mock analysis results. On the x-axis the true parameter values are provided by the best-fit model + noise consitute the mock SED catalog. These true values are compared with the PDF value estimated by CIGALE on the y-axis. The 1-to-1 correlation line is shown as a black long dashed line in each panel. From top left to bottom right, we show the results for the age of the stellar population, e-folding timescale of delay-τ SFH, SFR, FUV dust attenuation, E(B − V), slope of the dust attenuation curve – δ, stellar mass, total IR luminosity, and Umin. The regression lines for each assumed configuration are also plotted as red solid lines.
Current usage metrics show cumulative count of Article Views (full-text article views including HTML views, PDF and ePub downloads, according to the available data) and Abstracts Views on Vision4Press platform.
Data correspond to usage on the plateform after 2015. The current usage metrics is available 48-96 hours after online publication and is updated daily on week days.
Initial download of the metrics may take a while.