Fig. 10.
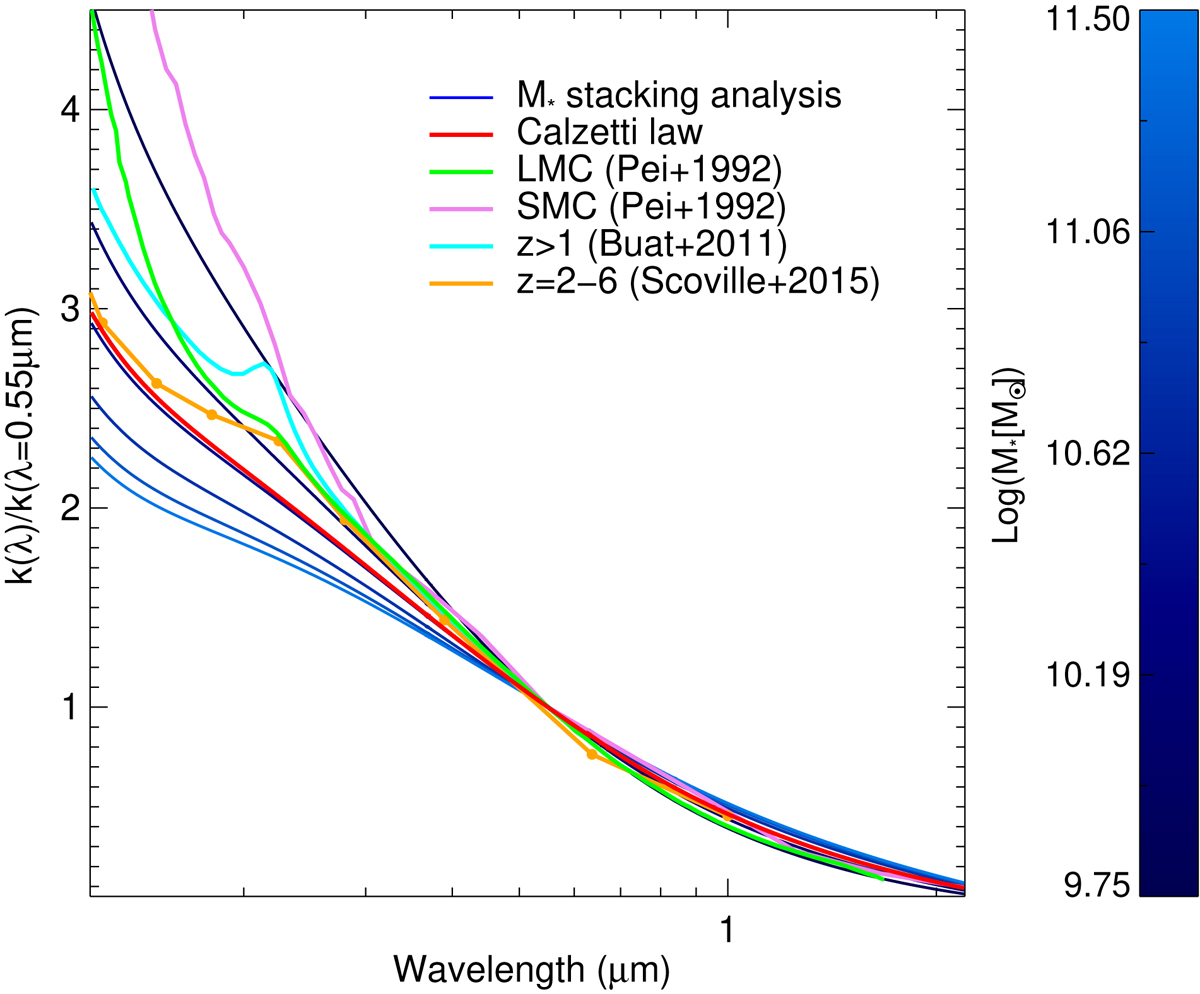
Dust attenuation curves derived from the SED-fitting analysis over the stacked LBGs SEDs obtained from the stacking analysis as a function of M*. These curves are color coded as a function of M*: light blue represents larger stellar masses which are grayer than Calzetti’s law (red line), and dark blue corresponds to lower stellar masses which are steeper than Calzetti’s law. As a comparison, we also show the LMC and SMC dust extinction curve (Pei 1992) and two additional attenuation curves derived from UV-selected galaxies at z > 1 (Buat et al. 2011) and star-forming galaxies at z ∼ 2–6 (Scoville et al. 2015).
Current usage metrics show cumulative count of Article Views (full-text article views including HTML views, PDF and ePub downloads, according to the available data) and Abstracts Views on Vision4Press platform.
Data correspond to usage on the plateform after 2015. The current usage metrics is available 48-96 hours after online publication and is updated daily on week days.
Initial download of the metrics may take a while.