Fig. 1.
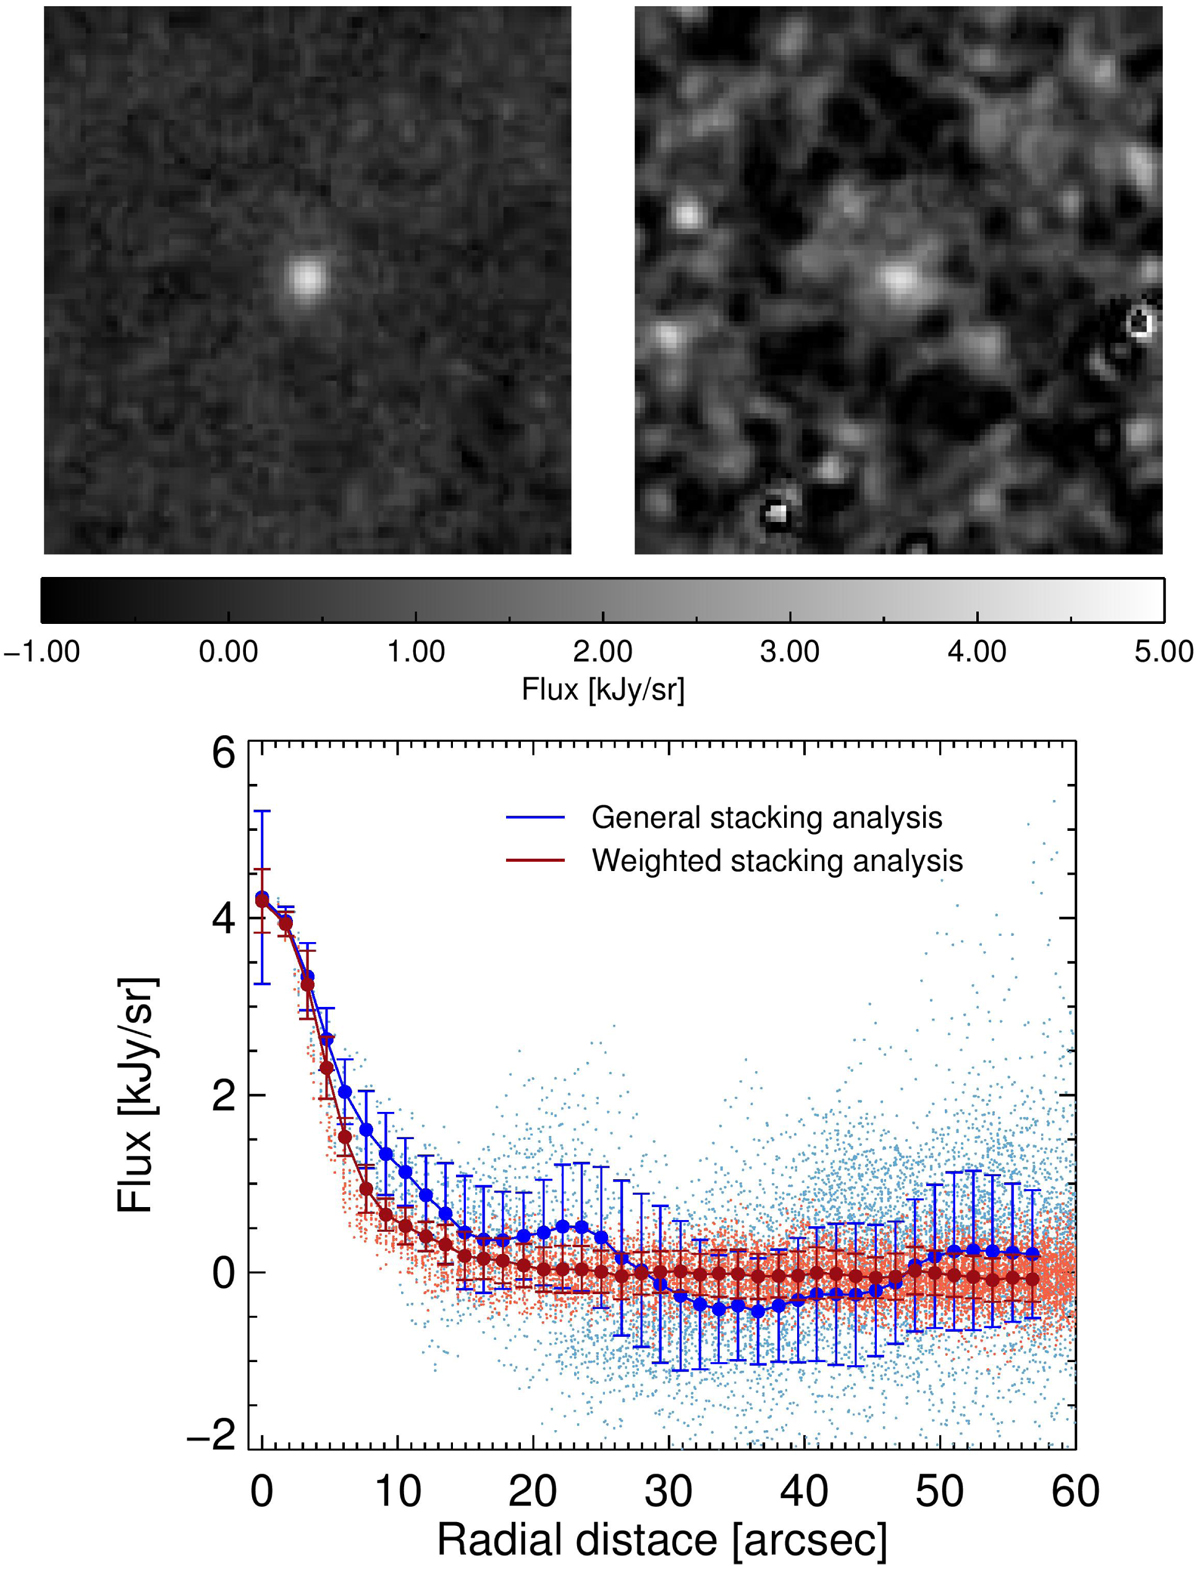
Top panel: maps of the final MIPS stacked images for the first bin as a function of the LFUV (10.2 < log(LFUV [L⊙]) > 10.5). Left panel: stacked image using the weighted stacking analysis and the right image using the general stacking method. Bottom panel: radial profiles estimated from the upper images. The blue line corresponds to the stacking analysis performed using the general method, and the red line correspond to the stacking analysis performed using the weighted method. The lighter blue and red points correspond to the value of each pixel from the stacked images.
Current usage metrics show cumulative count of Article Views (full-text article views including HTML views, PDF and ePub downloads, according to the available data) and Abstracts Views on Vision4Press platform.
Data correspond to usage on the plateform after 2015. The current usage metrics is available 48-96 hours after online publication and is updated daily on week days.
Initial download of the metrics may take a while.