| Issue |
A&A
Volume 630, October 2019
|
|
|---|---|---|
| Article Number | A98 | |
| Number of page(s) | 10 | |
| Section | Extragalactic astronomy | |
| DOI | https://doi.org/10.1051/0004-6361/201935650 | |
| Published online | 26 September 2019 | |
XMMSL2 J144605.0+685735: a slow tidal disruption event
1
Telespazio-Vega UK for ESA, European Space Astronomy Centre, Operations Department, 28691 Villanueva de la Cañada, Spain
e-mail: This email address is being protected from spambots. You need JavaScript enabled to view it.
, This email address is being protected from spambots. You need JavaScript enabled to view it.
2
Dept. of Physics and Astronomy, University of Leicester, Leicester LE1 7RH, UK
3
Max Planck Institut für Radioastronomie, Auf dem Huegel 69, 53121 Bonn, Germany
4
Universidad de Chile, Observatorio Astronomico Nacional Cerro Calan, Santiago, Chile
5
Center for Interdisciplinary Exploration and Research in Astrophysics (CIERA) and Department of Physics and Astronomy, Northwestern University, Evanston, IL 60208, USA
6
Liverpool John Moores University, Liverpool L3 5RF, UK
7
Dpto. de Física de la Tierra y Astrofísica, Facultad de Ciencias Físicas, Universidad Complutense de Madrid, 28040 Madrid, Spain
8
Harvard-Smithsonian Center for Astrophysics, 60 Garden St., Cambridge, MA 02138, USA
Received:
10
April
2019
Accepted:
15
August
2019
Abstract
Aims. We investigate the evolution of X-ray selected tidal disruption events.
Methods. New events are found in near real-time data from XMM-Newton slews, and are monitored by multi-wavelength facilities.
Results. In August 2016, X-ray emission was detected from the galaxy XMMSL2 J144605.0+685735 (also known as 2MASX 14460522+6857311), that was 20 times higher than an upper limit from 25 years earlier. The X-ray flux was flat for ∼100 days and then fell by a factor of 100 over the following 500 days. The UV flux was stable for the first 400 days before fading by a magnitude, while the optical (U,B,V) bands were roughly constant for 850 days. Optically, the galaxy appears to be quiescent, at a distance of 127 ± 4 Mpc (z = 0.029 ± 0.001) with a spectrum consisting of a young stellar population of 1–5 Gyr in age, an older population, and a total stellar mass of ∼6 × 10⁹ M⊙. The bolometric luminosity peaked at Lbol ∼ 1043 ergs s−1 with an X-ray spectrum that may be modelled by a power law of Γ ∼ 2.6 or Comptonisation of a low-temperature thermal component by thermal electrons. We consider a tidal disruption event to be the most likely cause of the flare. Radio emission was absent in this event down to < 10 μJy, which limits the total energy of a hypothetical off-axis jet to E < 5 × 1050 ergs. The independent behaviour of the optical, UV, and X-ray light curves challenges models where the UV emission is produced by reprocessing of thermal nuclear emission or by stream-stream collisions. We suggest that the observed UV emission may have been produced from a truncated accretion disc and the X-rays from Compton upscattering of these disc photons.
Key words: galaxies: individual: XMMSL2 J144605.0+685735 / galaxies: individual: 2MASX 14460522+6857311 / X-rays: galaxies
NHFP Einstein Fellow.
© ESO 2019
1. Introduction
The close approach of a star to a supermassive black hole (SMBH) can lead to the destruction of the stellar body in a process known as a tidal disruption event (TDE; Hills 1975). Gravitationally bound material returns to the black hole and is accreted, giving rise to a flare whose electromagnetic signature peaks in the extreme ultraviolet (EUV) band (Rees 1988; Ulmer 1999). These flares were first detected in the soft X-ray band by ROSAT (Komossa et al. 2004; Bade et al. 1996; Komossa & Greiner 1999; Komossa & Bade 1999), later by XMM-Newton and Chandra (Esquej et al. 2007; Saxton et al. 2012a, 2017; Maksym et al. 2010; Lin et al. 2015) (see review by Komossa 2017), and also in the UV band by GALEX (Gezari et al. 2006, 2008, 2009). In recent years, large-area optical surveys have detected candidate TDEs emitting at temperatures of a few ×104 K (van Velzen et al. 2011; Cenko et al. 2012a; Gezari et al. 2012; Arcavi et al. 2014; Holoien et al. 2016), ostensibly too cool to be coming from an accretion disc (e.g. Bonning et al. 2007). This optical radiation has been interpreted as being due to reprocessing of the accretion radiation by an optically thick screen (Metzger & Stone 2016; Roth & Kasen 2018; Dai et al. 2018) or to emission from shocks (Piran et al. 2015). Super-Eddington accretion in the initial phase of the disruption causes a large-scale, radiation-driven outflow of material from the central engine (Strubbe & Quataert 2009), which Metzger & Stone (2016) showed would initially completely absorb the radiation from the central engine and convert it into optical/UV photons with an effective temperature similar to that observed. In this model, the screen density is expected to drop after a few months to the point where the inner thermal radiation would become visible, with the delay time and ratio of X-ray to optical/UV flux depending on the line of sight (Metzger & Stone 2016; Dai et al. 2018). Observationally, the evidence for differences in the X-ray and UV/optical timescales is mixed. The X-rays may have lagged the UV by ∼32 days in ASASSN-14li (Pasham et al. 2017), but broadly fell on the same timescale (Brown et al. 2017), as they did in 2MASX 0740-85 (Saxton et al. 2017). In SDSS J1201+30 the UV flux did not change, while the X-rays dropped by a factor of 100 (Saxton et al. 2012a), whereas in ASASSN-15oi the X-ray luminosity was quite low (LX ∼ 1041 ergs s−1) at the peak of the optical flare, but 200–300 days later had increased to LX ∼ 1042ergs s−1 (Holoien et al. 2018; Gezari et al. 2017).
Clear evidence of reprocessing is offered by broad low-ionisation optical lines, which indicate a large covering angle of material orbiting the nucleus. Komossa et al. (2008) identified broad hydrogen and helium lines and highly ionised narrow iron lines in SDSS J095209.56+214313.3, which were seen to fade over time. Similar bright, broad lines have been seen in other archival SDSS data (Wang et al. 2011) and in more recent optically discovered TDE such as ASSASN-14li (Holoien et al. 2016). Reprocessing features are, however, not generally seen in the post-disruption optical spectra of X-ray selected TDEs on timescales of days to months (e.g. Saxton et al. 2012a, 2017) or years (e.g. Komossa & Greiner 1999; Lin et al. 2017). Hence, the relationship between the emission mechanisms in the X-ray and UV bands remains an outstanding problem.
In August 2016, the XMM-Newton slew survey (Saxton et al. 2008) detected a flare from the nucleus of the quiescent galaxy 2MASX 14460522+6857311. Further monitoring has shown enhanced emission in the UV band. In Sect. 2 we discuss the discovery of this flare and the source identification. In Sects. 3–5 we present X-ray, UV, optical, and radio follow-up observations. In Sect. 6 we perform a temporal and spectral analysis of the source, and in Sect. 7 we discuss the flare characteristics within the TDE model. The paper is summarised in Sect. 8.
A Λ cold dark matter cosmology with (ΩM, ΩΛ) = (0.27, 0.73) and H0 = 70 km−1 s−1 Mpc−1 has been assumed throughout.
2. X-ray flare identification
During the slew 9305900002, performed on August 22, 2016, XMM-Newton (Jansen 2001) detected a source, XMMSL2 J144605.0+685735 (hereafter XMMSL2 J1446+68), with an EPIC-pn, medium filter, 0.2–2 keV count rate of 1.2 ± 0.4 count s−1.
The source position, with a 1σ error of 8″, lies 6″ from the galaxy 2MASX 14460522+6857311 (hereafter 2MASX 1446+6857) and 18″ from the 11th magnitude A star, HD 23235465 (Fig. 1). On September 12, 2016, XMM-Newton made a pointed observation of the source and found an X-ray source consistent with the coordinates of the nucleus of 2MASX 1446+6857 (also known as LEDA 2725953) and no emission from the star.
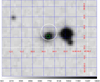 |
Fig. 1. Digital sky survey image. Shown is the XMM-Newton slew error circle (8″ radius; white) and UVOT-enhanced Swift, 90% confidence, error circle (1.5″ radius; green) centred on the detections and coincident with the nucleus of the galaxy 2MASX 14460522+6857311. The bright object immediately to the west of the galaxy is the 11th magnitude star HD 23235465. |
It was possible to perform a very crude analysis on the 11 photons in the slew spectrum to investigate the gross spectral properties of the detection. Detector matrices were calculated, taking into account the transit of the source across the detector, using a technique outlined in Read et al. (2008). A simple absorbed power-law fit gives a slope Γ = 2.7 ± 1.0 assuming no intrinsic absorption above the Galactic value of 1.9 × 1020 cm−2 (Willingale et al. 2013). This corresponds to an absorbed flux of F0.2 − 2 ∼ 2 ± 0.7 × 10⁻¹² ergs s−1 cm−2 using the above model. We calculate a 2σ upper limit from the ROSAT All-Sky Survey (RASS) at this position of 0.010 count s−1 (see Esquej et al. 2007, for a description of the upper limit calculation), a factor of 20 lower 0.2–2 keV flux using the same spectral model.
3. X-ray and UV observations
An X-ray monitoring programme was initiated with the Neil Gehrels Swift Observatory (hereafter Swift; Gehrels et al. 2004) to follow the evolution of the source flux and spectrum. Snapshot 3ks observations were made, initially once a week and then less frequently, with the X-ray telescope (XRT; Burrows et al. 2005) in photon counting mode and the UV optical telescope (UVOT; Roming et al. 2005). The Swift-XRT observations were analysed following the procedure outlined in Evans et al. (2009) and the UVOT data were reduced as described in Poole et al. (2008). An accurate position for the source in the Swift-XRT field can be determined by matching the UVOT field of view with the USNO-B1 catalogue and registering the XRT field accordingly (Goad et al. 2007). The resulting source position, αJ2000 = 14 : 46 : 05.13, δJ2000 = 68 : 57 : 30.8 (±1.5″; 90% confidence) is coincident with the 2MASS position of the galactic nucleus (see Fig. 1) to within the 90% confidence uncertainty.
In parallel, five XMM-Newton pointed observations were triggered between September 8, 2016 and April 25 2018 (observation ID=0763640201, 0763640401, 0763640501, 0763640601, 0823330101). A summary of observations and exposure times is given in Table 1. In each observation, the EPIC-pn and MOS-1 cameras were operated in full frame mode with the thin1 filter in place, while the MOS-2 camera was used in small window mode with the medium filter. The source was too faint for statistically significant data to be collected from the reflection grating spectrometers.
X-ray observation log of XMMSL2 J1446+68.
The XMM data were analysed with the XMM-Newton Science Analysis System (SAS v16.0.1; Gabriel et al. 2003). Light curves were extracted from the observations and searched for periods of high background flaring revealing that the first four observations were considerably affected by background. Observations 1, 3, and 4 could be cleaned by filtering out periods of high background, but observation 2 had moderate background for the whole exposure and has been used in its entirety. For observations 1 and 4 we used a single contiguous section of data from mission reference time 589743669-589748442 and 596642336-596651995, respectively. For observation 3 we created a light curve over the whole field of view from single-pixel events in the energy range 10–12 keV. We then produced a series of good time intervals where the count rate in this light curve was < = 1.4 c/s and used these to extract the source spectrum.
4. Optical observations
A set of optical observations were initiated shortly after the discovery of XMMSL2 J1446+68. Photometry was obtained to monitor the flux evolution in the optical bands and complement the UVOT observations. Spectroscopic observations were made to check for the presence of a persistent AGN and to look for broad or narrow line features which may have been produced by material reprocessing the nuclear flare emission.
4.1. Photometry
XMMSL2 J1446+68 was observed with the ESA Test-Bed Telescope Cebreros (MPC code Z58; Ocaña et al. 2016) with the prime focus 4Kx4K CCD camera using B,V, R Johnson filters. Short observations of 30–90 seconds were taken on September 6, 2016, September 20, 2016, and October 31, 2016. Differential photometry was provided by using up to 2000 nearby stars from the catalogue UCAC-4. Photometric residuals are better than 0.1 magnitude.
4.2. Spectroscopy
A low-resolution (R ∼ 350, λ = 4000 − 8000 Å) optical spectrum of XMMSL2 J1446+68 was obtained using the SPRAT spectrograph (Piascik et al. 2014) of the 2.0 m Liverpool Telescope (Steele et al. 2004) on September 5, 2016. The exposure time used was 300 s. The spectrum was reduced and calibrated using the standard pipeline (Smith et al. 2016), and showed a non-active galaxy (Fig. 2) at a redshift of z = 0.029 ± 0.001.
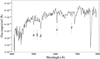 |
Fig. 2. Optical spectrum (observed frame) of XMMSL2 J1446+68 taken with the SPRAT spectrograph on the 2 m Liverpool Telescope on September 5, 2016. |
XMMSL2 J1446+68 was also observed with the FAST spectrograph on the 60-inch telescope at Fred Lawrence Whipple Observatory (FLWO) on September 4, 2016 (Fig. 3). The two 900 s spectra were extracted and wavelength-calibrated using an automated pipeline, and flux-calibrated using a standard star taken on the same night. These observations confirmed the redshift of z = 0.029 ± 0.001.
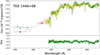 |
Fig. 3. Optical spectrum of XMMSL2 J1446+68 taken on September 4, 2016 with the FAST instrument on the FLWO telescope (light green) fitted with a stellar population model shown in dark green and pink (see text for details of the fitting procedure). The mean Swift-UVOT filter fluxes from the period September 12, 2016 to August 14, 2017 are overplotted as red squares (U,B,V) and blue circles (UVW1,UVM2,UVW2). The GALEX-NUV filter point from 2007 is shown as a purple triangle. |
The stellar population of XMMSL2 J1446+68 was analysed using the STARLIGHT spectral population synthesis code (Cid Fernandes et al. 2005, 2011). The code uses the Bruzual & Charlot (2003) single stellar population models and requires the data to be corrected for foreground Galactic extinction and taken to the rest frame. We used the Cardelli et al. (1989) extinction curve to correct for foreground reddening and adopted AV = 0.064 and shifted the spectrum to the rest wavelength using z = 0.029. Figure 3 presents the results from the spectral population synthesis analysis showing the observed and total synthetic spectra and its residuals. The mean Swift-UVOT filter fluxes from the flat part of the UV light curve (September 12, 2016 to August 14, 2017) are overplotted on the synthetic spectrum, as is a GALEX-NUV pre-flare flux from 2007 (see Sect. 6.1). The fit needs a relatively young stellar population of 1 − 5 Gyr to model the blue flux in conjunction with an older population. The total initial mass of the galaxy is 1.1 × 10¹⁰ M⊙ and the current mass 5.7 × 10⁹ M⊙ after correcting for the gas restored to the ISM. The residuals clearly show that no emission lines are present in XMMSL2 J1446+68.
5. Radio observations
We observed XMMSL2 J1446+68 at 6.0 GHz and 21.7 GHz with the National Science Foundation Karl G. Jansky Very Large Array (VLA) on 2016 September 15.16 UT and 2017 February 22.52 UT. The first observation was taken while the VLA was moving from B configuration into its most extended A configuration and used 3C48 as the flux calibrator and J1436+6336 as the gain calibrator at both frequencies. The second was taken in the most compact D configuration of the VLA and used J1438+6211 as the gain calibrator at 6 GHz, J1436+6336 as the gain calibrator at 21.7 GHz, and 3C286 as the flux calibrator at both frequencies. We reduced and imaged the data using standard Common Astronomy Software Applications (CASA) routines (McMullin et al. 2007).
We did not detect any radio emission at the enhanced Swift position of XMMSL2 J1446+68 or at the position of the nearby star HD 23235465. We determined the image root mean square (rms) noise at the source position using the imtool package (part of pwkit; Williams et al. 2017). In the first observation, we find rms values of 9 μJy at 6.0 GHz and 28 μJy at 21.7 GHz; in the second the rms values are 6 μJy at 6.0 GHz and 28 μJy at 21.7 GHz. The more constraining 5σ upper limits on the 6 GHz radio luminosity of XMMSL2 J1446+68 are shown in Fig. 4 in comparison to other TDEs. The radio limits for XMMSL2 J1446+68 are the deepest radio limits for any X-ray TDE obtained to date, and the deepest limits for any TDE on timescales of a few months. Only one optical TDE, iPTF16fnl, was found to have a deeper radio limit just days after discovery (Blagorodnova et al. 2017). However, iPTF16fnl remains the faintest and fastest-fading optical TDE discovered to date, and therefore may not be representative of the typical population. XMMSL2 J1446+68 is ≳105 times fainter than the radio-loud jetted TDE Swift J164449.3+573451 and ≳20 times fainter than the canonical radio-weak TDE ASASSN-14li at comparable epochs (Berger et al. 2012; Alexander et al. 2016), making it highly unlikely that XMMSL2 J1446+68 launched either a relativistic jet or a sub-relativistic outflow.
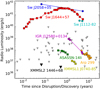 |
Fig. 4. Upper limits on the radio luminosity of XMMSL2 J1446+68 (black triangles) compared with other TDEs and plotted against observed time since disruption or discovery. The coloured points are radio detections of TDEs from the literature (Zauderer et al. 2011, 2013; Berger et al. 2012; Eftekhari et al. 2018; Cenko et al. 2012b; Pasham et al. 2015; Brown et al. 2015; Irwin et al. 2015; Perlman et al. 2017; Alexander et al. 2016, 2017; Mattila et al. 2018), while the grey triangles are upper limits from non-detections (Bower et al. 2013; van Velzen et al. 2013, 2019; Arcavi et al. 2014; Chornock et al. 2014; Blagorodnova et al. 2017; Blanchard et al. 2017, Alexander et al. 2019 and references therein). All upper limits are 5σ. |
6. X-ray light curve
In Fig. 5 we show the historical light curve of XMMSL2 J1446+68. The soft X-ray (0.2–2 keV) flux is effectively constant for the first ∼90 days, with a temporary drop of a factor 2 after 24 days, which we attribute to small variations in the local accretion rate. It then drops by a factor of 10 over the following ∼100 days and a further factor of 10 by day 600. Modelling the observed X-ray emission as a constant, from the discovery date t0 = August 22, 2016 to a later date tdrop when the flux follows a power-law decay, we find that at time t
 (1)
(1)
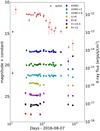 |
Fig. 5. Long-term X-ray, UV, and optical light curve of XMMSL2 J1446+68 plotted against time. From top to bottom: 0.2–2 keV, UVW2 (1928 Å), UVM2 (2246 Å), UVW1 (2600 Å), U (3465 Å), B (4500 Å), V (5430 Å), and R (6580 Å). X-ray points are shown as red stars, Swift-UVOT filters as circles, XMM-Newton-OM filter points as diamonds, and the Cebreros telescope points as squares. A GALEX-NUV measurement, taken in 2007 and calibrated to the UVM2 filter values, is shown as a green triangle and the RASS soft X-ray upper limit from 1990–1991 as a downward red triangle. All points show the observed fluxes and magnitudes without host galaxy subtraction. |
where (t − t0) is in units of days and tdrop = November 19, 2017 ± 2 days.
In Fig. 6 we show the exposure-corrected, background-subtracted, 0.2–2.0 keV short-term light curve from the XMM-Newton pointed observation of September 16, 2016. The X-ray flux shows small variations on short timescales, which can be used to obtain an estimate of the black hole mass. We used the method of Ponti et al. (2012) on a 10 ks segment of the September 9, 2016 XMM-Newton pointed observation, finding an insignificant excess variance of 0.007 ± 0.02, from which we extracted a 90% confidence lower limit on the mass of MBH ≥ 2 × 10⁶ M⊙. We note, however, that this technique was calibrated on AGNs, which may not be strictly applicable to the variability seen in a TDE.
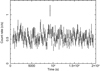 |
Fig. 6. Background subtracted, exposure corrected, EPIC-pn, 0.2–2 keV light curve for the September 16, 2016 XMM-Newton pointed observation, displayed in 100 s bins. |
Quasi-periodic oscillations (QPO) have been found in the X-ray light curves of some TDEs (Reis et al. 2012; Pasham et al. 2019; Lin et al. 2013). We barycentred the event file of the XMM-Newton observation of September 9, 2016, created source and background time series, and searched for a QPO in the power spectrum. No significant peaks were found.
6.1. UV light curve
During the five pointed XMM-Newton observations, the optical monitor (OM) cycled between the B, U, UVW1, UVM2, and UVW2 filters. Swift-UVOT observations were performed with the UVW1, UVM2, and UVW2 filters, except for the first six observations and the final observation, which also used the optical U,B,V filters. The galaxy was detected in all filters in all the observations except for the final XMM-Newton observation, which did not detect the galaxy in the UVW2 filter using the source search software. A faint object is visible by eye, however, and so the magnitude of this source was extracted by analysing the image directly. Relative filter fluxes were determined using several nearby sources of comparable brightness as references. The absolute flux scale was taken from the Swift-UVOT filters, with the XMM-Newton-OM points scaled to these values.
GALEX observed the position of the galaxy between 2005-03-05 and 2007-02-18. There is no detection of the galaxy present in the catalogue (Bianchi et al. 2017); however, a faint enhancement is visible by eye in the near-UV (NUV filter) image (2267 Å) lying within the radial profile of the bright A star, HD 23235465. By using the catalogue magnitudes of the surrounding stars and galaxies, and an analysis of the count rates in this image we calculate that the NUV magnitude of the galaxy was 21.0 ± 0.15 (AB magnitude) during the GALEX observations, which is 1.2 mag below the OM-UVM2 magnitude from September 8, 2016. The NUV filter has a similar bandpass to the UVM2 filter and gives consistent magnitudes to within Δm = 0.026, with a conservative standard deviation due to colour-dependence and other systematic effects of 0.33 mag (Page et al. 2012). To illustrate the variation in the UVM2/GALEX-NUV flux, in Fig. 7 we show images of the field around XMMSL2 J1446+68 in the GALEX observation and the OM-UVM2 observations from September 30, 2016 and April 25, 2018.
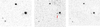 |
Fig. 7. GALEX-NUV image taken in 2007 (left), XMM-OM UVM2 image from September 30, 2016 (middle; XMMSL2 J1446+68 indicated by red arrow), and XMM-OM UVM2 image from April 25, 2018 (right). |
In Fig. 5 we see that the UVW2 and UVM2 fluxes remained roughly constant for the first ∼400 days, but had fallen by ∼1 magnitude by day 6001. Using the GALEX-NUV observation as a measurement of the quiescent galaxy flux we find a galaxy-subtracted UVM2 flux of 1.2 × 10⁻¹³ ergs s−1 cm−2. The optical filters do not vary significantly over the 850 days of monitoring, indicating that the optical flux is dominated by the host galaxy.
6.2. X-ray spectral analysis
We extracted spectra from the second XMM-Newton pointed observation (hereafter XMM2), which was taken 25 days after discovery and has the highest exposure time, from circles with optimum radii determined by the task eregionanalyse for the EPIC-pn, MOS-1, and MOS-2 cameras. Background spectra were created from nearby source-free regions. The source spectra were grouped to have a minimum of 20 counts per bin and were fitted simultaneously within the XSPEC package (v12.8.2). Fits were performed using the chi-squared statistic over the energy range 0.3–10 keV. Quoted errors are at the 90% confidence level unless otherwise stated.
As a first step we fit the XMM2 observation with a simple power-law model and galactic absorption of 1.9 × 1020 cm−2, modelled by TBABS with elemental abundances set to those in Wilms et al. (2000). The fit is good ( /347) with a slope of Γ = 2.59 ± 0.03. If we fit only over the 2–10 keV range, the slope flattens to 2.48 ± 0.26 and small residuals are present at lower energies. We attempted to model the low-energy excess as an extra emission component, with a black body of
  eV (
eV ( ). The extra component is not statistically significant. We also tried modelling the soft component with a Bremsstrahlung (
 ;
;  eV) and power law (
 ). We repeated this for the five XMM-Newton pointed observations2, finding that an absorbed power law provided a satisfactory fit for each. In Table 2 we show the results of these fits, all of which are consistent with a power-law slope of 2.5–2.6.
Spectral fits to XMM-Newton pointed observations of XMMSL2 J1446+68.
The same fitting process was applied to the Swift XRT observations from 0.3–10 keV. Figure 8 shows the fitted slope of each observation, which is effectively constant, within the errors, between discovery and 600 days later.
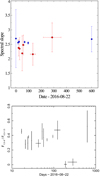 |
Fig. 8. Upper: 0.3–10.0 keV spectral slope from absorbed power-law fits to the XMM-Newton (blue circles) and Swift (red diamonds) observations of XMMSL2 J1446+68. Some of the Swift observations have been combined to reduce the error bar size. Lower: source spectral hardness expressed as the ratio of the 1.5–8 keV to 0.3–1.5 keV fluxes. |
To improve the statistics we combined the counts from the clean data in observations 1, 3, and 4 from the XMM-Newton EPIC-pn camera. This yielded a power-law slope of 2.58 ± 0.04 and χ2 = 165/183. Using the full EPIC-pn dataset from observations 1-4, without applying any background filtering, we get a consistent slope of Γ = 2.58 ± 0.03 and χ2 = 425/410 suggesting that the periods of higher background do not cause significant spectral deviations (Fig. 9). We then used this “dirty” combined spectrum of 45.9 ks to look for spectral features beyond the simple power law. A small improvement can be found by adding a black-body component (χ2 = 414/408) with  eV when the power-law slope reduces to 2.43 ± 0.08. In this case 13 ± 6% of the total 0.2–2 keV flux is provided by the soft component. A Comptonised black-body model (COMPBB in XSPEC; Nishimura et al. 1986) gives a similar result (χ2 = 416/408) with a very low black-body temperature (
 eV), electron temperature (
 keV), and optical depth (
 ). In summary, the X-ray spectrum is dominated by a somewhat steep power law of slope ∼2.6 with weak evidence for a faint excess at low energies. The fifth XMM-Newton observation has low statistics, but gives a consistent spectral slope of
  , to within the errors.
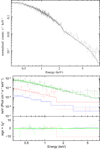 |
Fig. 9. Upper: fit of the EPIC-pn spectrum combined from the first four XMM-Newton observations to a power law absorbed by the Galactic column of 1.9 × 1020 cm−2. Lower: spectra from the first Swift observation (September 12, 2016; black), the XMM-Newton observations of November 27, 2016 (green) and April 25, 2018 (blue), and the combined data from Swift between February 15, 2017 and August 14, 2017 (red), all fitted with a power law of Γ = 2.58 absorbed by the Galactic column. Residuals to the fits are shown below. |
The unabsorbed 0.2–10 keV luminosity from the XMM-Newton slew observation of August 22, 2016 fit with a power law of Γ = 2.58 is LX = 6 × 1042 ergs s−1. The bolometric correction is quite uncertain for this spectrum and we need to model the full dataset carefully to try and estimate the flux that emerges in the EUV band. To find the UV flux from the flare we subtract the contribution of the stellar population of the host galaxy using the GALEX flux for the UVM2 filter (see Sect. 6.1), and use the fifth XMM-Newton observation for the UVW2 filter. The contribution of the galaxy to the total filter flux, from the first XMM-Newton observation, is then 20% (UVW2) and 33% (UVM2). Under the assumption that the UV and X-ray emission both come from a coherent accretion structure, we fit the galaxy-subtracted UVM2 and UVW2 data and the X-ray spectrum from XMM observation 1, with the optxagnf model (Done et al. 2012). This model consists of a multi-colour disc and a corona of optically thick electrons which Compton scatter disc photons to X-ray energies3. Given the number of free parameters in the model we assume a non-spinning black hole (a = 0) and use a prior for the black hole mass.
From the relationship of black hole mass to bulge K-band luminosity (Marconi & Hunt 2003) we get MBH ∼ 5 × 10⁶ M⊙ from the point source 2MASS magnitude of mK = 13.06 ± 0.05 (or 12.2 extended), with a systematic error of 0.3 dex (2 × 106 M⊙). Using the current galaxy stellar mass of 5.7 × 10⁹ M⊙, we find a mass of MBH = 2 × 10⁷ M⊙ (rms error of 0.6 dex; Reines & Volonteri 2015). The black hole mass in 2MASX 1446+6857 has also been calculated from the MBH − σ relation (Wevers et al. 2019) as  . We use the lower and higher of these estimated masses in the optxagnf fits (see Table 3). The bolometric luminosity from the XMM1 observation can be obtained from these fits using
  , where ṁ is the accretion rate in units of the Eddington accretion rate, giving Lbol = 1.0(1.3)×1043 ergs s−1 for a black hole mass of 5 × 10⁶ (7 × 10⁷) M⊙. The radius where emission transitions from a thermal black-body spectrum to a Comptonised spectrum is 46.3 (100) Rg for the fits. At this radius, very little of the thermal emission falls within the soft X-ray band, which is therefore dominated by Compton upscattering of the UV photons. Using the same model, the Swift observation of August 14, 2017 (which has a similar UV flux to XMM1, but an X-ray flux lower by a factor of 10) has Lbol ∼ 30% that of XMM1, with a lower optical depth of the Comptonising electrons. The absorption-corrected luminosity in the UVM2 and UVW2 filters, after subtraction of the quiescent galaxy flux, was Luv = 2 − 3 × 1041 ergs s−1 in both observations.
Spectral fits with the optxagnf model to UV and X-ray data of XMMSL2 J1446+68.
As a further test of the stability of the X-ray spectrum we calculated the ratio between a soft (0.3–1.5 keV) and hard (1.5–8 keV) energy band for all of the X-ray observations (Fig. 8). In this plot we see an apparent strong softening of two spectra produced from the combination of Swift observations 00034707017, 00034707018, 00034707019 (February 15, 2017 to March 13, 2017) and 00034707020, 00034707021, 00034707022 (March 26, 2017 to August 14, 2017). The data from Swift observations 00034707017-00034707022 were combined into a single spectrum to maximise the signal-to-noise ratio, and compared with the last two XMM-Newton observations and the first Swift observation, all fit with an absorbed power law of Γ = 2.58 (Fig. 9). The combined Swift spectrum does not appear to be softer than the other spectra, but rather to be lacking flux above 1.5 keV. It may be fit with a power law (Γ = 2.69 ± 0.44; χ2 = 46/39) or alternatively by a black body ( eV; χ2 = 43/39), both absorbed by the Galactic column. Adding an empirical edge of energy (
 keV) and optical depth (τ = 10.0) to a Γ = 2.58 power-law model improves the fit (to χ2 = 37/38). We note that this trend is not what is expected from cold absorption, which would have exactly the opposite effect on an X-ray spectrum. Detailed photo-ionisation modelling of the TDE in NGC 5905 has shown that individual deep absorption edges of high column density, ionised material can potentially imprint sharp spectral features (e.g. Komossa & Bade 1999). However, the deepest edge is that expected from oxygen, around 0.7 keV rest frame (see also Kara et al. 2018). While we formally can fit the spectra with a single absorption edge at 1.62 keV, this does not correspond to any known transition, and we consider this solution highly artificial, and do not discuss it further. Alternative interpretations could involve changes in the property of the accretion disc corona, which would primarily affect the hard X-ray photons. However, at present we do not have enough data to constrain this scenario further.
7. Discussion
The lack of emission lines in optical spectra makes it unlikely that XMMSL2 J1446+68 was a steadily emitting AGN before the 2016 flare. The Wide-field Infrared Survey Explorer (WISE) colours, W1–W2 = 0.0, are also suggestive of a non-active galaxy (Stern et al. 2012), and with a peak bolometric luminosity of ∼1043 ergs s−1 it seems more likely that this event was caused by a TDE. From the density of WISE objects we calculate a 0.6% probability that there is a foreground object lying within 1.5″ of the galaxy nucleus. The possibility of galactic sources mimicking a TDE spectrum and light curve was discussed in the early TDE literature (e.g. Komossa & Bade 1999; Komossa & Greiner 1999) and the only remaining credible galactic TDE impostor is a nova (e.g. Mainetti et al. 2016). The rate of galactic novae is estimated to be 50 per year (Shafter 2017), and as the space density of galaxies is 0.0177 Mpc−3 (Driver 2005) then the probability of one of these novae lying within 1.5″ of the nucleus of a galaxy out to a distance of 127 Mpc is 3 × 10⁻⁵ per year. As the slew survey covers ∼10% of the sky each year and has been running for ten years, then the probability that the slew survey has seen one such event is 3 × 10⁻⁵. Therefore, we conclude that the flare most likely originates within the galaxy 2MASX 1446+6857.
If we integrate the luminosity over the full light curve we obtain a total emitted bolometric luminosity of 4 × 1050 ergs. As we have no knowledge of the flux prior to discovery, this is necessarily a lower limit. This total energy release is equivalent to a consumed mass of 2 × 10⁻³ M⊙ assuming a conversion efficiency of η = 0.1. While we may well have discovered the event post-peak and so be underestimating the total emitted radiation, this result does agree with the trend seen in many other TDEs where the radiated mass is just a fraction of a percent of a solar mass (e.g. Komossa et al. 2004; Holoien et al. 2018; Saxton et al. 2017; Maksym et al. 2010). In some earlier work this low integrated luminosity has led to very low estimates of the mass of the disrupted object, and suggestions that a giant planet or the outer layers of an evolved star had been accreted rather than debris from a main-sequence star (Li et al. 2002; Nikolajuk & Walter 2013). The apparent ubiquity of the low integrated luminosity (only 3XMM, J150052.0+015452 has so far radiated the equivalent of a large fraction of a solar mass; Lin et al. 2017) argues instead for a mechanism where the majority of the disrupted mass is not promptly accreted or where the multi-wavelength radiation is strongly suppressed. Some evidence for this is given by late-time IR emission produced by the heating of material lying at ∼1 pc from the nucleus, which implies a true emitted luminosity ten times higher than that seen directly (e.g. Komossa et al. 2009; van Velzen et al. 2016).
This particular TDE is unusual in two key ways: a) the X-ray flux begins to fade long before the UV flux; b) the X-ray spectrum is characterised by a single steep (Γ ∼ 2.6) power law rather than a soft pseudo-thermal component or a hard power law of Γ ∼ 1.3 − 2.3, as seen in the radio-loud TDE (Nikolajuk & Walter 2013; Burrows et al. 2011; Cenko et al. 2012b).
Piran et al. (2015) describe a scenario, backed up by simulations (Shiokawa et al. 2015; Bonnerot et al. 2017), where the UV and optical emission is produced by shocks from inter-stream collisions, while the X-ray radiation is produced by the later accretion of this same material. This model predicts a delay in the X-rays with respect to the UV. Support was given to this model by the X-ray flux apparently lagging behind the UV flux by 32 days in ASASSN-14li (Pasham et al. 2017) and by a delay in the onset of observed X-rays in ASASSN-15oi (Gezari et al. 2017).
Another attempt to describe the mutual exclusivity of optical and X-ray TDEs is given by the unified TDE model (Dai et al. 2018), which conjectures that X-ray TDEs are seen when the viewing angle looks down a funnel directly onto the accretion structure, while optical TDEs are produced by the reprocessing of accretion-driven X-ray photons (see also Metzger & Stone 2016; Roth et al. 2016). In this case the UV should be simultaneous with the X-rays, or a little delayed due to light-travel time, as the reprocessing is more or less instantaneous.
Neither of these models naturally explains the dichotomy between the X-ray and UV light curves in this TDE. We need a mechanism that maintains the near-UV luminosity from the TDE at an approximately constant value of ∼3 × 1041 ergs s−1 for 400 days while the X-ray luminosity drops by an order of magnitude. As the X-ray spectrum is consistent between the 5 XMM-Newton observations and the Swift observations before February 15, 2017, the reduction in flux in these observations is likely to be intrinsic rather than due to intervening absorption. We note that the combined Swift spectrum of February 15, 2017 to August 14, 2017 (days 177–356), has a relative deficit of photons at high energies, but we are unable to find a physically meaningful interpretation for this spectrum.
If the UV were purely caused by X-ray reprocessing then it should scale with the X-rays. On the other hand, if the UV is generated from inter-stream shocks then this would indicate a constant rate of return of material over the first 400 days.
A possible solution could be that the matter around the black hole formed a disc that spread outwards and accreted viscously (Cannizzo et al. 1990). van Velzen et al. (2019) saw evidence for this in late-time UV measurements of ten TDEs, consistent with a strong flattening of the far-UV and near-UV emission after 1–2 years and an average black-body temperature of 104 − 5 K. They showed that this could result in a UV light curve that decayed very slowly (t−0.1) with a roughly constant temperature. They predicted a low X-ray flux for their TDE sample based purely on the expected emission from disc thermal processes. We see in XMMSL2 J1446+68 and other events (Saxton et al. 2012b; Lin et al. 2017) that Compton upscattering of thermal photons by a warm electron population provides an important contribution to the X-ray emission at all energies that cannot be neglected. In Sect. 6.2 we saw that the fading X-rays could be reproduced by a reduction in the optical depth of a population of Comptonising electrons, while the seed UV photons from the disc remain fairly constant.
The variety of X-ray spectra that are seen in TDEs is striking. Many events, for example NGC 5905, RX J1242.6-1119, RX J1420.4+5334, NGC 3599, SDSS 1323+48, ASASSN-14li, and 3XMM J150052.0+015452, were dominated by a very soft component near peak, reasonably well fit by thermal (black-body-like) emission (e.g. Komossa & Bade 1999; Komossa et al. 2004; Esquej et al. 2008; Miller et al. 2015; Lin et al. 2017). Others, such as SDSS J095209.56+214313.3, Swift 1644+57, 2MASX 0740-85, 2MASS 0619-65, and IGR J12580+0134, displayed a hard power law (Komossa et al. 2008; Burrows et al. 2011; Saxton et al. 2017, 2014; Nikolajuk & Walter 2013) of slope Γ ∼ 1.3 − 2.3. XMMSL2 J1446+68, however, has a steep power law (Γ ∼ 2.6) that does not change, while the flux drops by a factor of 1004. We constrained the radio emission in this TDE to < 10 μJy, the deepest upper limit for a TDE to date, which makes it unlikely that the X-rays were produced by a jet. The total energy of any off-axis jet can be constrained to E < 5 × 1050 ergs for circumnuclear densities > 0.1 cm−3 (Generozov et al. 2017).
The event may be self-consistently explained if the debris formed a viscously evolving, truncated accretion disc that emitted thermally in the UV and EUV bands, and a population of warm electrons that upscattered the thermal photons into a pseudo-power law of X-ray photons.
8. Summary
A flare was detected from the galaxy 2MASX 1446+6857 on August 22, 2016, reaching a bolometric luminosity, Lbol ∼ 1043 ergs s−1. The source flux subsequently decayed by a factor of 100 in the 0.2–2 keV X-ray band over 600 days, but barely changed in the UV filters for the first 400 days and then dropped by about one magnitude in the UVM2 and UVW2 bands. The galaxy shows no signs of previous AGN activity, and we attribute the flare to the accretion of debris from a star that was tidally destroyed during a close approach to the nuclear black hole. The apparent independence of the X-ray and UV light curves may point to the creation of a slowly evolving, long-lived accretion disc structure in this event. The X-ray spectrum can be modelled with a power law of Γ ∼ 2.6 throughout the evolution of the event (although a deficit of high-energy photons was noticed during the middle of the monitoring) and may be solely due to Compton upscattering of thermal photons from the disc. This event is radio-quiet to a level LR < 4 × 1036 ergs s−1, which constrains the total energy emitted by an off-axis jet to < 5 × 1050 ergs, the deepest limit yet achieved for an X-ray selected TDE.
We confirmed that none of the Swift-UVOT observations fell on the regions of low sensitivity reported in Edelson et al. (2015).
Only observations 1, 2, 3, and 4 had sufficient statistics to warrant the inclusion of the MOS camera data. Observation 5 was fit with the EPIC-pn data alone.
It also includes a power-law component, which we set to zero in the fits.
There is evidence for a deficit of high-energy photons in the later Swift observations. This had disappeared by the time of the last XMM-Newton observation.
Acknowledgments
We thank the anonymous referee for the useful comments which improved the manuscript, and the XMM OTAC for approving this programme. The XMM-Newton project is an ESA science mission with instruments and contributions directly funded by ESA member states and the USA (NASA). The XMM-Newton project is supported by the Bundesministerium für Wirtschaft und Technologie/Deutches Zentrum für Luft- und Raumfahrt i (BMWI/DLR, FKZ 50 OX 0001), the Max-Planck Society, and the Heidenhain-Stiftung. We thank the Swift team for approving and performing the monitoring observations. This work made use of data supplied by the UK Swift Science Data Centre at the University of Leicester. This paper uses data products produced by the OIR Telescope Data Center, supported by the Smithsonian Astrophysical Observatory. The Liverpool Telescope is operated on the island of La Palma by Liverpool John Moores University in the Spanish Observatorio del Roque de los Muchachos of the Instituto de Astrofisica de Canarias with financial support from the UK Science and Technology Facilities Council. Some of the data presented in this paper were obtained from the Mikulski Archive for Space Telescopes (MAST). STScI is operated by the Association of Universities for Research in Astronomy, Inc., under NASA contract NAS5-26555. K.D.A. acknowledges support provided by NASA through the NASA Hubble Fellowship grant HST-HF2-51403.001 awarded by the Space Telescope Science Institute, which is operated by the Association of Universities for Research in Astronomy, Inc., for NASA, under contract NAS5-26555. The National Radio Astronomy Observatory is a facility of the National Science Foundation operated under cooperative agreement by Associated Universities, Inc. Nick Stone and Thomas Wevers are warmly thanked for helpful comments.
References
- Alexander, K., Berger, E., Guillochon, J., Zauderer, B., & Williams, P. 2016, ApJ, 819, 25 [NASA ADS] [CrossRef] [Google Scholar]
- Alexander, K., Wieringa, M., Berger, E., Saxton, R., & Komossa, S. 2017, ApJ, 837, 153 [NASA ADS] [CrossRef] [Google Scholar]
- Alexander, K., van Velzen, S., Horesh, A., & Zauderer, B. 2019, Space Sci. Rev., submitted [Google Scholar]
- Arcavi, I., Gal-Yam, A., Sullivan, M., et al. 2014, ApJ, 793, 38 [NASA ADS] [CrossRef] [Google Scholar]
- Bade, N., Komossa, S., & Dahlem, M. 1996, A&A, 309, L35 [NASA ADS] [Google Scholar]
- Berger, E., Zauderer, A., Pooley, G., et al. 2012, ApJ, 748, 36 [NASA ADS] [CrossRef] [Google Scholar]
- Bianchi, L., Shiao, B., & Thilker, D. 2017, ApJS, 230, 24 [NASA ADS] [CrossRef] [Google Scholar]
- Blagorodnova, N., Gezari, S., Hung, T., et al. 2017, ApJ, 844, 46 [NASA ADS] [CrossRef] [Google Scholar]
- Blanchard, P., Nicholl, M., Berger, E., et al. 2017, ApJ, 843, 106 [Google Scholar]
- Bonnerot, C., Rossi, E., & Lodato, G. 2017, MNRAS, 464, 2816 [NASA ADS] [CrossRef] [Google Scholar]
- Bruzual, G., & Charlot, S. 2003, MNRAS, 344, 1000 [NASA ADS] [CrossRef] [Google Scholar]
- Bonning, E., Cheng, L., Shields, G., Salviander, S., & Gerbhardt, K. 2007, ApJ, 659, 211 [NASA ADS] [CrossRef] [Google Scholar]
- Bower, G., Metzger, B., Cenko, S., Silverman, J., & Bloom, J. 2013, ApJ, 763, 84 [NASA ADS] [CrossRef] [Google Scholar]
- Brown, G., Levan, A., Stanway, E., et al. 2015, MNRAS, 452, 4297 [NASA ADS] [CrossRef] [Google Scholar]
- Brown, G., Holoien, T., Auchettl, K., et al. 2017, MNRAS, 466, 4904 [Google Scholar]
- Burrows, D., Hill, J., Nousek, J., et al. 2005, Space Sci. Rev., 120, 165 [NASA ADS] [CrossRef] [Google Scholar]
- Burrows, D., Kennea, J., Ghisellini, G., et al. 2011, Nature, 476, 421 [NASA ADS] [CrossRef] [PubMed] [Google Scholar]
- Cannizzo, J., Lee, H., & Goodman, J. 1990, ApJ, 351, 38 [NASA ADS] [CrossRef] [Google Scholar]
- Cardelli, J., Clayton, G., & Mathis, J. 1989, ApJ, 345, 245 [NASA ADS] [CrossRef] [Google Scholar]
- Cenko, S., Krimm, H., Horesh, A., et al. 2012a, ApJ, 753, 77 [NASA ADS] [CrossRef] [Google Scholar]
- Cenko, S., Bloom, J., Kulkarni, S., et al. 2012b, MNRAS, 420, 2684 [NASA ADS] [CrossRef] [Google Scholar]
- Chornock, R., Berger, E., Gezari, S., et al. 2014, ApJ, 780, 44 [NASA ADS] [CrossRef] [Google Scholar]
- Cid Fernandes, R., Mateus, M., Sodre Jr., L., Stasinka, G., & Gomes, J. 2005, MNRAS, 358, 363 [NASA ADS] [CrossRef] [Google Scholar]
- Cid Fernandes, R., Stasinka, G., Mateus, A., & Vale Asari, N. 2011, MNRAS, 413, 1687 [NASA ADS] [CrossRef] [Google Scholar]
- Dai, L., McKinney, J., Roth, N., Ramirez-Ruiz, E., & Coleman Miller, M. 2018, ApJ, 859, L20 [Google Scholar]
- Done, C., Davis, S., Jin, C., Blaes, O., & Ward, M. 2012, MNRAS, 420, 1848 [NASA ADS] [CrossRef] [Google Scholar]
- Driver, S., Liske, J., Cross, N., De Propis, R., & Allen, P. 2005, MNRAS, 360, 81 [NASA ADS] [CrossRef] [Google Scholar]
- Edelson, R., Gelbord, J., Horne, K., et al. 2015, ApJ, 806, 129 [NASA ADS] [CrossRef] [Google Scholar]
- Eftekhari, A., Berger, E., Zauderer, B., Margutti, R., & Alexander, K. 2018, ApJ., 854, 86 [NASA ADS] [CrossRef] [Google Scholar]
- Esquej, P., Saxton, R., Freyberg, M., et al. 2007, A&A, 462L, 49 [Google Scholar]
- Esquej, P., Saxton, R., Komossa, S., Read, A., & Freyberg, M. J. 2008, A&A, 489, 543 [NASA ADS] [CrossRef] [EDP Sciences] [Google Scholar]
- Evans, P., Beardmore, A., Page, K., et al. 2009, MNRAS, 397, 1177 [NASA ADS] [CrossRef] [Google Scholar]
- Gabriel, C., Denby, M., Fyfe, D. J., et al. 2003, ASP Conf. Ser., 314, 759 [Google Scholar]
- Gehrels, N., Chincarini, G., Giommi, P., et al. 2004, ApJ, 611, 1005 [NASA ADS] [CrossRef] [Google Scholar]
- Generozov, A., Mimica, P., Metzger, B., et al. 2017, MNRAS, 464, 2481 [NASA ADS] [CrossRef] [Google Scholar]
- Gezari, S., Martin, D., Milliard, B., et al. 2006, ApJ, 653L, 25 [Google Scholar]
- Gezari, S., Basa, S., Martin, D., et al. 2008, ApJ, 676, 944 [NASA ADS] [CrossRef] [Google Scholar]
- Gezari, S., Heckman, T., Cenko, S., et al. 2009, ApJ, 698, 1367 [NASA ADS] [CrossRef] [Google Scholar]
- Gezari, S., Chornock, R., Rest, A., et al. 2012, Nat., 485, 217 [NASA ADS] [CrossRef] [Google Scholar]
- Gezari, S., Cenko, S., & Arcavi, I. 2017, ApJ, 851, 47 [NASA ADS] [CrossRef] [Google Scholar]
- Goad, M., Tyler, L., Beardmore, A., et al. 2007, A&A, 476, 1401 [NASA ADS] [CrossRef] [EDP Sciences] [Google Scholar]
- Hills, J. 1975, Nature, 254, 295 [NASA ADS] [CrossRef] [Google Scholar]
- Holoien, T., Kochanek, C., Prieto, J., et al. 2016, MNRAS, 455, 2918 [NASA ADS] [CrossRef] [Google Scholar]
- Holoien, T., Brown, J., Auchettl, K., et al. 2018, MNRAS, 480, 5689 [NASA ADS] [CrossRef] [Google Scholar]
- Irwin, J., Henriksen, R., Krause, M., et al. 2015, ApJ, 809, 172 [NASA ADS] [CrossRef] [Google Scholar]
- Jansen, F., Lumb, D., Altieri, B., et al. 2001, A&A, 365, L1 [NASA ADS] [CrossRef] [EDP Sciences] [Google Scholar]
- Kara, E., Dai, L., Reynolds, C. S., & Kallman, T. 2018, MNRAS, 474, 3593 [NASA ADS] [CrossRef] [Google Scholar]
- Komossa, S. 2017, AN, 338, 256 [NASA ADS] [Google Scholar]
- Komossa, S., & Bade, N. 1999, A&A, 343, 775 [NASA ADS] [Google Scholar]
- Komossa, S., & Greiner, J. 1999, A&A, 349, L45 [NASA ADS] [Google Scholar]
- Komossa, S., Halpern, J., Schartel, N., et al. 2004, ApJ, 603, L17 [NASA ADS] [CrossRef] [Google Scholar]
- Komossa, S., Zhou, H., Wang, T., et al. 2008, ApJ, 678, 13 [Google Scholar]
- Komossa, S., Zhou, H., Rau, A., et al. 2009, ApJ, 701, 105 [NASA ADS] [CrossRef] [Google Scholar]
- Li, L.-X., Narayan, R., & Menou, K. 2002, ApJ, 576, 753 [NASA ADS] [CrossRef] [Google Scholar]
- Lin, D., Irwin, J., Godet, O., Webb, N. A., & Barret, D. 2013, ApJ, 776, L10 [NASA ADS] [CrossRef] [Google Scholar]
- Lin, D., Maksym, W., Irwin, J., et al. 2015, ApJ, 811, 43 [NASA ADS] [CrossRef] [Google Scholar]
- Lin, D., Guillochon, J., Komossa, S., Ramirez-Ruiz, E., & Irwin, J. 2017, Nat. Astron., 1, 33 [NASA ADS] [CrossRef] [Google Scholar]
- Mainetti, D., Campana, S., & Colpi, M. 2016, A&A, 592, 41 [CrossRef] [EDP Sciences] [Google Scholar]
- Maksym, W., Ulmer, M., & Eracleous, M. 2010, ApJ, 722, 1035 [NASA ADS] [CrossRef] [Google Scholar]
- Marconi, A., & Hunt, L. 2003, ApJ, 589, L21 [NASA ADS] [CrossRef] [Google Scholar]
- Mattila, S., Prez-Torres, M., Efstathiou, A., et al. 2018, Sci., 361, 482 [NASA ADS] [Google Scholar]
- McMullin, J., Waters, B., Schiebel, D., Young, W., & Golap, K. 2007, ASPC, 376, 127 [Google Scholar]
- Metzger, B., & Stone, N. 2016, MNRAS, 461, 948 [NASA ADS] [CrossRef] [Google Scholar]
- Miller, J., Kaastra, J., Miller, M., et al. 2015, Nature, 526, 542 [NASA ADS] [CrossRef] [Google Scholar]
- Nikolajuk, M., & Walter, R. 2013, A&A, 552, 75 [NASA ADS] [CrossRef] [EDP Sciences] [Google Scholar]
- Nishimura, J., Mitsuda, K., & Itoh, M. 1986, PASJ, 38, 819 [NASA ADS] [Google Scholar]
- Ocaña, F., Ibbara, A., Racero, E., et al. 2016, SPIE, 9906, 66 [Google Scholar]
- Page, M., Brindle, C., Talavera, A., Still, M., & Rosen, S. 2012, MNRAS, 426, 903 [Google Scholar]
- Pasham, D., Cenko, S., Levan, A., et al. 2015, ApJ, 805, 68 [NASA ADS] [CrossRef] [Google Scholar]
- Pasham, D., Cenko, S., Sadowski, A., et al. 2017, ApJ, 837, 30 [NASA ADS] [CrossRef] [Google Scholar]
- Pasham, D., Remillard, R., Fragile, P., et al. 2019, Sci., 363, 531 [Google Scholar]
- Perlman, E., Meyer, E., Wang, Q., et al. 2017, ApJ, 842, 126 [NASA ADS] [CrossRef] [Google Scholar]
- Piascik, A. S., Steele, I., Bates, S. D., et al. 2014, SPIE, 9147, 8 [Google Scholar]
- Piran, T., Svirski, G., Krolik, J., Cheng, R., & Shiokawa, H. 2015, ApJ, 806, 164 [NASA ADS] [CrossRef] [Google Scholar]
- Ponti, G., Papadakis, I., Bianchi, S., et al. 2012, A&A, 542, A83 [NASA ADS] [CrossRef] [EDP Sciences] [Google Scholar]
- Poole, T. S., Breeveld, A. A., Page, M. J., et al. 2008, MNRAS, 383, 627 [NASA ADS] [CrossRef] [Google Scholar]
- Read, A., Saxton, R., Torres, M., et al. 2008, A&A, 482, L1 [NASA ADS] [CrossRef] [EDP Sciences] [Google Scholar]
- Rees, M. J. 1988, Nature, 333, 523 [NASA ADS] [CrossRef] [Google Scholar]
- Reines, A., & Volonteri, M. 2015, ApJ, 813, 82 [NASA ADS] [CrossRef] [Google Scholar]
- Reis, R., Miller, J., Reynolds, M., et al. 2012, Science, 337, 949 [NASA ADS] [CrossRef] [Google Scholar]
- Roming, P. W., Kennedy, T. E., & Mason, K. O. 2005, SSRv, 120, 95 [Google Scholar]
- Roth, N., & Kasen, D. 2018, ApJ, 855, 54 [NASA ADS] [CrossRef] [Google Scholar]
- Roth, N., Kasen, D., Guillochon, J., & Ramirez-Ruiz, E. 2016, ApJ, 827, 3 [NASA ADS] [CrossRef] [Google Scholar]
- Saxton, R., Read, A., Esquej, P., et al. 2008, A&A, 480, 611 [NASA ADS] [CrossRef] [EDP Sciences] [Google Scholar]
- Saxton, R., Read, A., Esquej, P., et al. 2012a, A&A, 541, 106 [Google Scholar]
- Saxton, R., Read, A., Komossa, S., & Esquej, P. 2012b, EPJ Web Conf., 39, 02002 [CrossRef] [Google Scholar]
- Saxton, R., Read, A., Komossa, S., et al. 2014, A&A, 572, 1 [Google Scholar]
- Saxton, R., Read, A., Komossa, S., et al. 2017, A&A, 598, 29 [Google Scholar]
- Shafter, A. 2017, ApJ, 834, 196 [NASA ADS] [CrossRef] [Google Scholar]
- Shiokawa, H., Krolik, J., Cheng, R., Piran, T., & Noble, S. 2015, ApJ, 804, 85 [NASA ADS] [CrossRef] [Google Scholar]
- Smith, R., Piascik, A., Steele, I., & Barnsley, R. 2016, SPIE, 9913, 17 [Google Scholar]
- Steele, I., Smith, R., Rees, P., Baker, I., Bates, S. D., et al. 2004, SPIE, 5489, 679 [NASA ADS] [Google Scholar]
- Stern, D., Assef, R., Benford, D., Blain, A., Cutri, R., et al. 2012, ApJ, 753, 30 [NASA ADS] [CrossRef] [Google Scholar]
- Strubbe, L., & Quataert, E. 2009, MNRAS, 400, 2070 [NASA ADS] [CrossRef] [Google Scholar]
- Ulmer, A. 1999, ApJ, 514, 180 [NASA ADS] [CrossRef] [Google Scholar]
- van Velzen, S., Farrar, G. R., Gezari, S., et al. 2011, ApJ, 741, 73 [NASA ADS] [CrossRef] [Google Scholar]
- van Velzen, S., Frai, D., Kording, E., & Falcke, H. 2013, A&A, 552, 5 [CrossRef] [EDP Sciences] [Google Scholar]
- van Velzen, S., Mendez, A., Krolik, J., & Gorjian, V. 2016, ApJ, 829, 19 [NASA ADS] [CrossRef] [Google Scholar]
- van Velzen, S., Stone, N., Metzger, B., et al. 2019, ApJ, 878, 82 [NASA ADS] [CrossRef] [Google Scholar]
- Wang, T.-G., Zhou, H.-Y., Wang, L.-F., Lu, H.-L., & Xu, D. 2011, ApJ, 740, 85 [NASA ADS] [CrossRef] [Google Scholar]
- Wevers, T., Stone, N., van Velzen, S., Jonker, P., Hung, T., et al. 2019, MNRAS, 487, 4136 [NASA ADS] [CrossRef] [Google Scholar]
- Williams, P., Clavel, M., Newton, E., & Ryzhkov, D. 2017, Astrophysics Source Code Library [record ascl:1704.001] [Google Scholar]
- Willingale, R., Starling, R., Beardmore, A., Tanvir, N., & O’Brien, P. 2013, MNRAS, 431, 394 [NASA ADS] [CrossRef] [Google Scholar]
- Wilms, J., Allen, A., & McCray, R. 2000, ApJ, 542, 914 [NASA ADS] [CrossRef] [Google Scholar]
- Zauderer, B., Berger, E., Soderberg, A. M., et al. 2011, Nature, 476, 425 [NASA ADS] [CrossRef] [PubMed] [Google Scholar]
- Zauderer, B., Berger, E., Margutti, R., et al. 2013, ApJ., 767, 152 [NASA ADS] [CrossRef] [Google Scholar]
All Tables
All Figures
|
Fig. 1. Digital sky survey image. Shown is the XMM-Newton slew error circle (8″ radius; white) and UVOT-enhanced Swift, 90% confidence, error circle (1.5″ radius; green) centred on the detections and coincident with the nucleus of the galaxy 2MASX 14460522+6857311. The bright object immediately to the west of the galaxy is the 11th magnitude star HD 23235465. |
| In the text | |
|
Fig. 2. Optical spectrum (observed frame) of XMMSL2 J1446+68 taken with the SPRAT spectrograph on the 2 m Liverpool Telescope on September 5, 2016. |
| In the text | |
|
Fig. 3. Optical spectrum of XMMSL2 J1446+68 taken on September 4, 2016 with the FAST instrument on the FLWO telescope (light green) fitted with a stellar population model shown in dark green and pink (see text for details of the fitting procedure). The mean Swift-UVOT filter fluxes from the period September 12, 2016 to August 14, 2017 are overplotted as red squares (U,B,V) and blue circles (UVW1,UVM2,UVW2). The GALEX-NUV filter point from 2007 is shown as a purple triangle. |
| In the text | |
|
Fig. 4. Upper limits on the radio luminosity of XMMSL2 J1446+68 (black triangles) compared with other TDEs and plotted against observed time since disruption or discovery. The coloured points are radio detections of TDEs from the literature (Zauderer et al. 2011, 2013; Berger et al. 2012; Eftekhari et al. 2018; Cenko et al. 2012b; Pasham et al. 2015; Brown et al. 2015; Irwin et al. 2015; Perlman et al. 2017; Alexander et al. 2016, 2017; Mattila et al. 2018), while the grey triangles are upper limits from non-detections (Bower et al. 2013; van Velzen et al. 2013, 2019; Arcavi et al. 2014; Chornock et al. 2014; Blagorodnova et al. 2017; Blanchard et al. 2017, Alexander et al. 2019 and references therein). All upper limits are 5σ. |
| In the text | |
|
Fig. 5. Long-term X-ray, UV, and optical light curve of XMMSL2 J1446+68 plotted against time. From top to bottom: 0.2–2 keV, UVW2 (1928 Å), UVM2 (2246 Å), UVW1 (2600 Å), U (3465 Å), B (4500 Å), V (5430 Å), and R (6580 Å). X-ray points are shown as red stars, Swift-UVOT filters as circles, XMM-Newton-OM filter points as diamonds, and the Cebreros telescope points as squares. A GALEX-NUV measurement, taken in 2007 and calibrated to the UVM2 filter values, is shown as a green triangle and the RASS soft X-ray upper limit from 1990–1991 as a downward red triangle. All points show the observed fluxes and magnitudes without host galaxy subtraction. |
| In the text | |
|
Fig. 6. Background subtracted, exposure corrected, EPIC-pn, 0.2–2 keV light curve for the September 16, 2016 XMM-Newton pointed observation, displayed in 100 s bins. |
| In the text | |
|
Fig. 7. GALEX-NUV image taken in 2007 (left), XMM-OM UVM2 image from September 30, 2016 (middle; XMMSL2 J1446+68 indicated by red arrow), and XMM-OM UVM2 image from April 25, 2018 (right). |
| In the text | |
|
Fig. 8. Upper: 0.3–10.0 keV spectral slope from absorbed power-law fits to the XMM-Newton (blue circles) and Swift (red diamonds) observations of XMMSL2 J1446+68. Some of the Swift observations have been combined to reduce the error bar size. Lower: source spectral hardness expressed as the ratio of the 1.5–8 keV to 0.3–1.5 keV fluxes. |
| In the text | |
|
Fig. 9. Upper: fit of the EPIC-pn spectrum combined from the first four XMM-Newton observations to a power law absorbed by the Galactic column of 1.9 × 1020 cm−2. Lower: spectra from the first Swift observation (September 12, 2016; black), the XMM-Newton observations of November 27, 2016 (green) and April 25, 2018 (blue), and the combined data from Swift between February 15, 2017 and August 14, 2017 (red), all fitted with a power law of Γ = 2.58 absorbed by the Galactic column. Residuals to the fits are shown below. |
| In the text | |
Current usage metrics show cumulative count of Article Views (full-text article views including HTML views, PDF and ePub downloads, according to the available data) and Abstracts Views on Vision4Press platform.
Data correspond to usage on the plateform after 2015. The current usage metrics is available 48-96 hours after online publication and is updated daily on week days.
Initial download of the metrics may take a while.