Fig. 3.
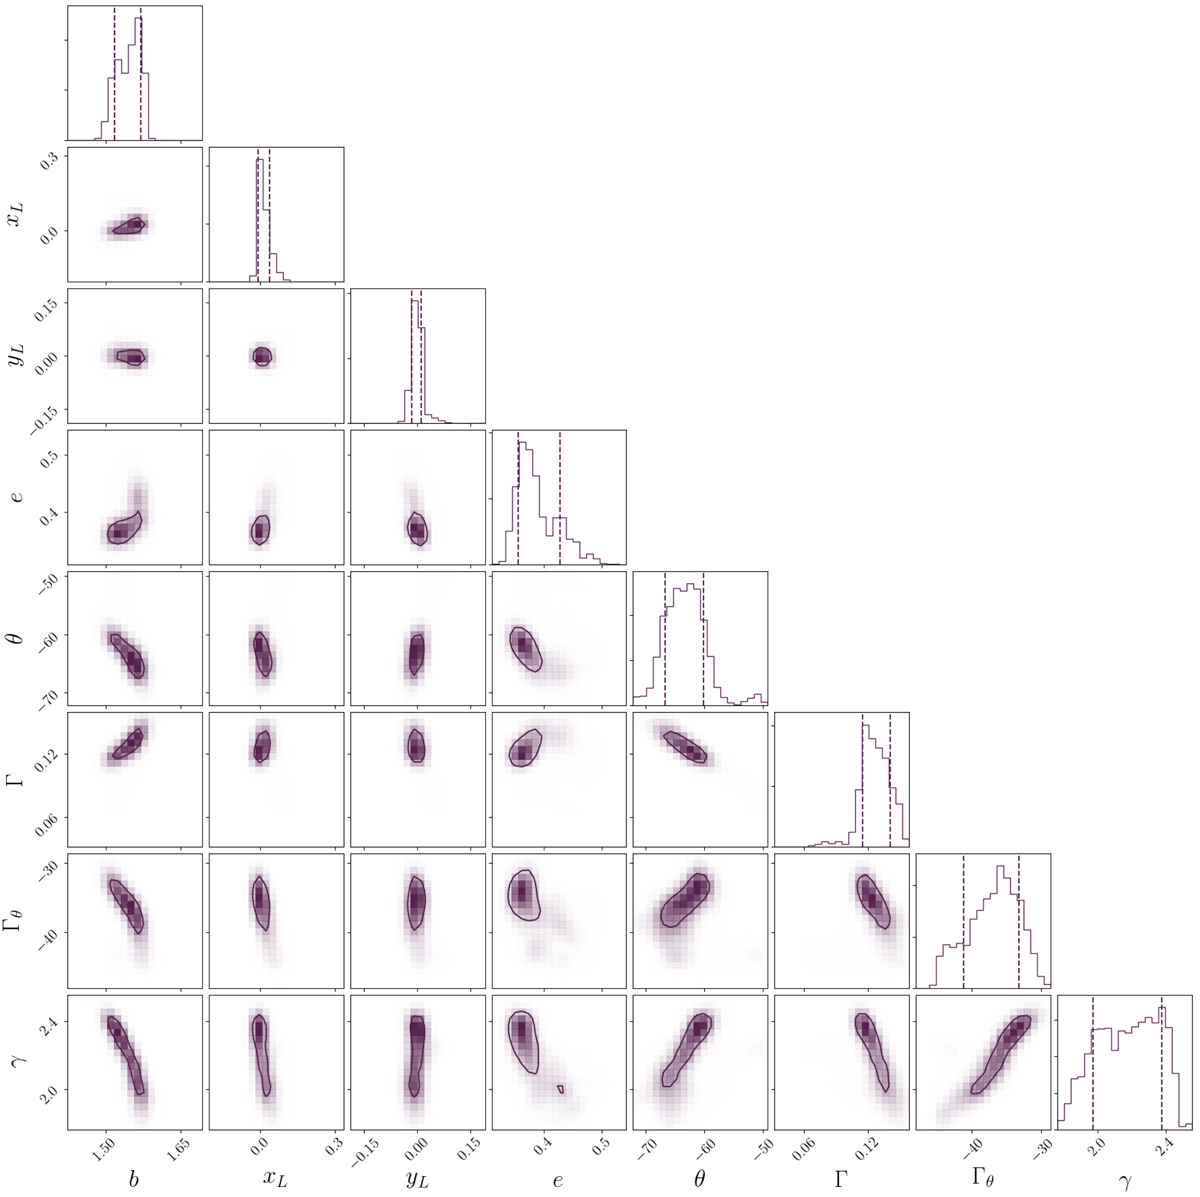
Diagonal histograms: probability density functions (PDFs) for the lens model parameters of the main lensing galaxy (D), which were obtained by marginalizing over all the other model parameters, with two dashed vertical lines indicating the 1σ limits. The other panels show the 2-dimensional contours of the PDF for each pair of model parameters, where the contours indicate the 1σ region. The meaning of the parameters, their maximum-likelihood model value and their uncertainties are presented in Table 3.
Current usage metrics show cumulative count of Article Views (full-text article views including HTML views, PDF and ePub downloads, according to the available data) and Abstracts Views on Vision4Press platform.
Data correspond to usage on the plateform after 2015. The current usage metrics is available 48-96 hours after online publication and is updated daily on week days.
Initial download of the metrics may take a while.