Fig. 7.
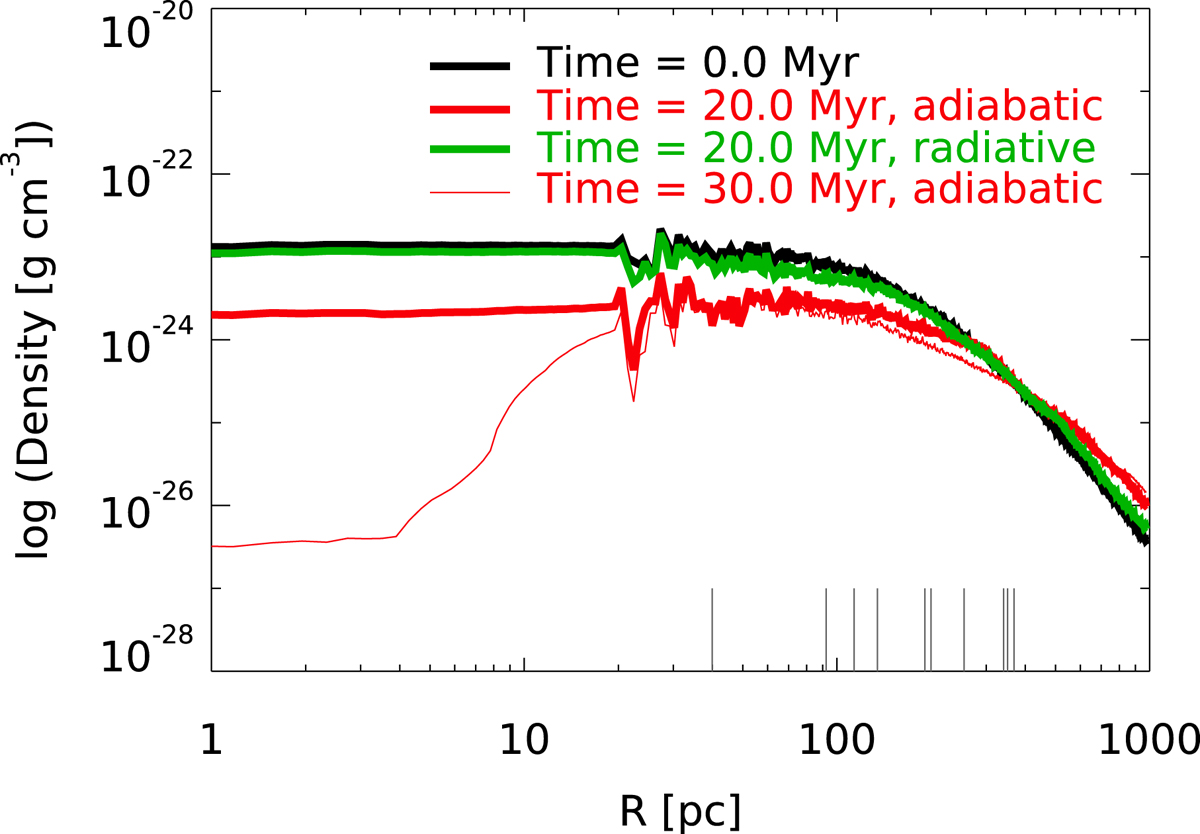
Initial (black line) and final density profiles for the adiabatic simulation (t = 30 Myr; thin red line) and for the run with radiative cooling (t = 20 Myr; thick green line). The density profile for the adiabatic simulation at t = 20 Myr (thick red line) is also shown. The vertical lines on the bottom indicate the location of the OB associations.
Current usage metrics show cumulative count of Article Views (full-text article views including HTML views, PDF and ePub downloads, according to the available data) and Abstracts Views on Vision4Press platform.
Data correspond to usage on the plateform after 2015. The current usage metrics is available 48-96 hours after online publication and is updated daily on week days.
Initial download of the metrics may take a while.