Fig. 5.
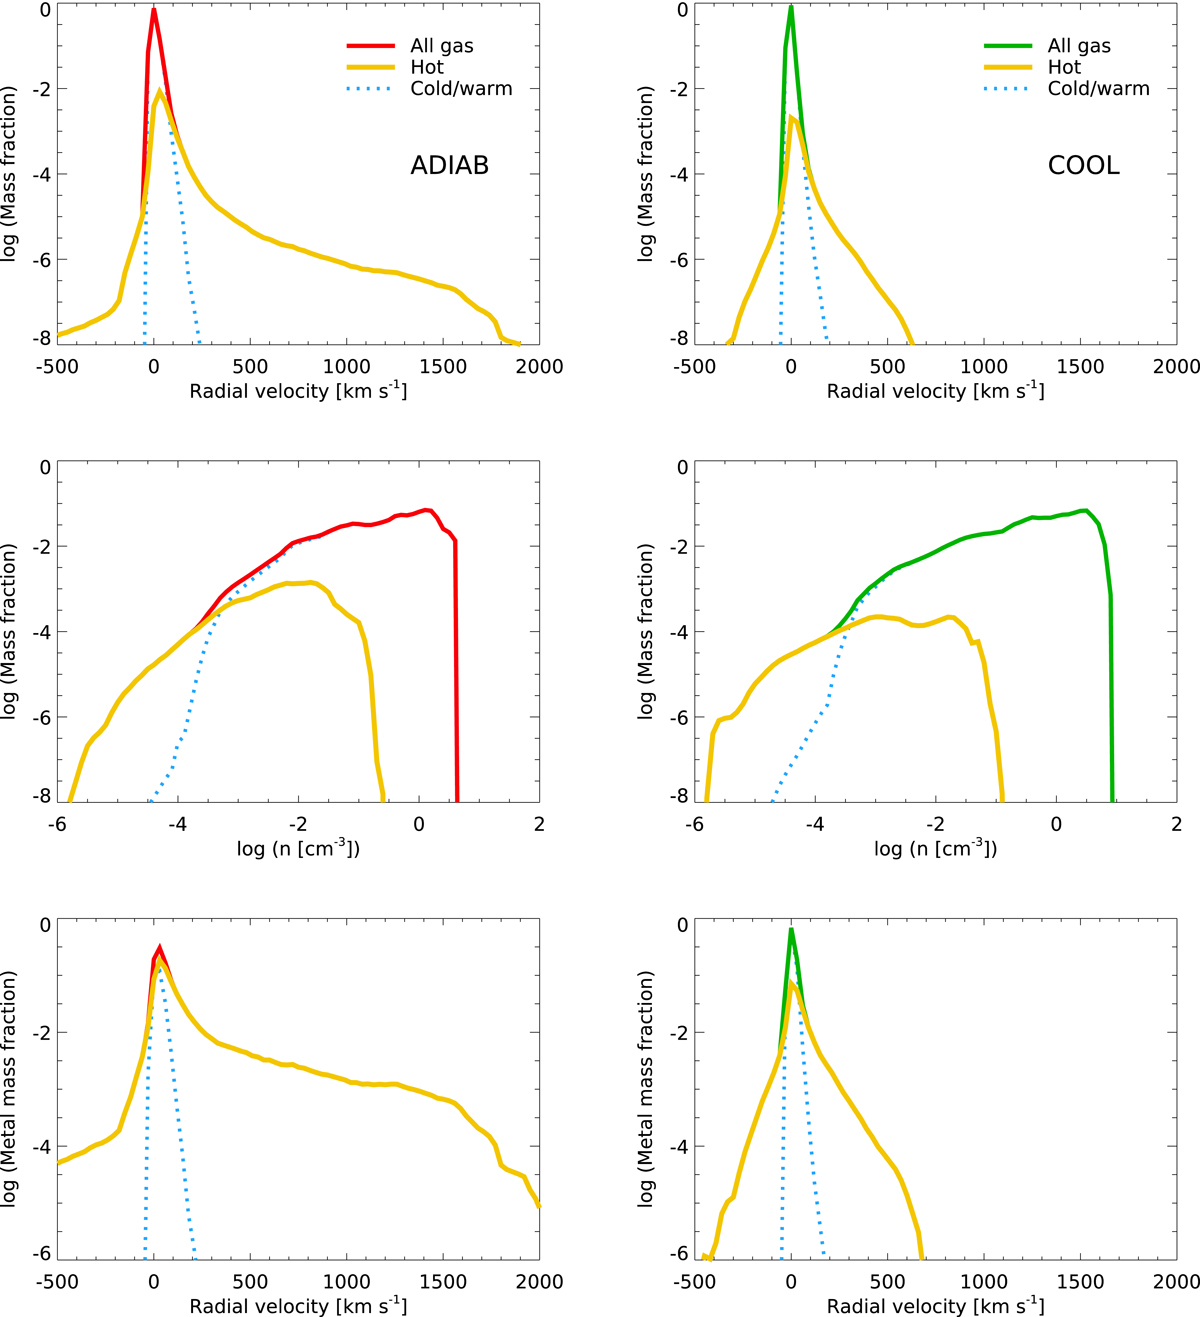
Mass-weighted distributions of gas radial velocity (upper panels) and density (middle panels) at t = 20 Myr, for the runs with (right-hand panels) and without radiative losses (left-hand panels). The distribution of metals in radial velocity bins at the same time for the two runs (lower panels) is also shown. The red (green) lines on the left (right) panels show all the gas and metals in the simulation volume. The yellow solid and blue dotted lines in all panels show the hot (T ≥ 105 K) and cold/warm (T < 105 K) components, respectively. The integrals of the red and green lines are normalized to unity.
Current usage metrics show cumulative count of Article Views (full-text article views including HTML views, PDF and ePub downloads, according to the available data) and Abstracts Views on Vision4Press platform.
Data correspond to usage on the plateform after 2015. The current usage metrics is available 48-96 hours after online publication and is updated daily on week days.
Initial download of the metrics may take a while.