Free Access
Fig. B.1.
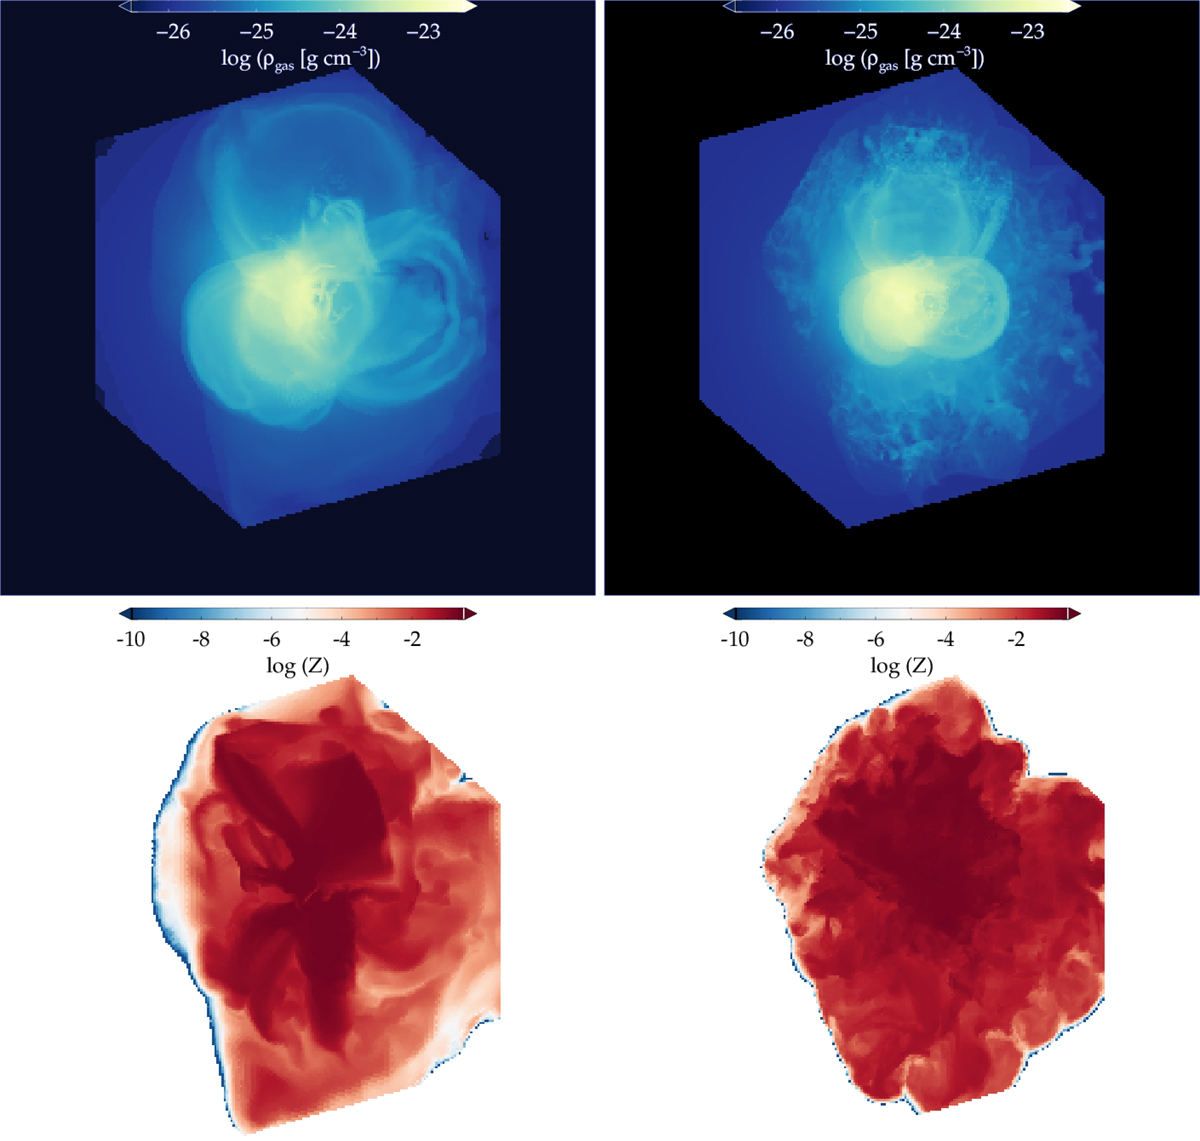
Three-dimensional structure of gas (top images) and metals (bottom images) in the simulation box at t = 20 Myr. The images on the left refer to the high-resolution adiabatic run, while those on the right are for the run with cooling.
Current usage metrics show cumulative count of Article Views (full-text article views including HTML views, PDF and ePub downloads, according to the available data) and Abstracts Views on Vision4Press platform.
Data correspond to usage on the plateform after 2015. The current usage metrics is available 48-96 hours after online publication and is updated daily on week days.
Initial download of the metrics may take a while.