Free Access
Fig. A.2.
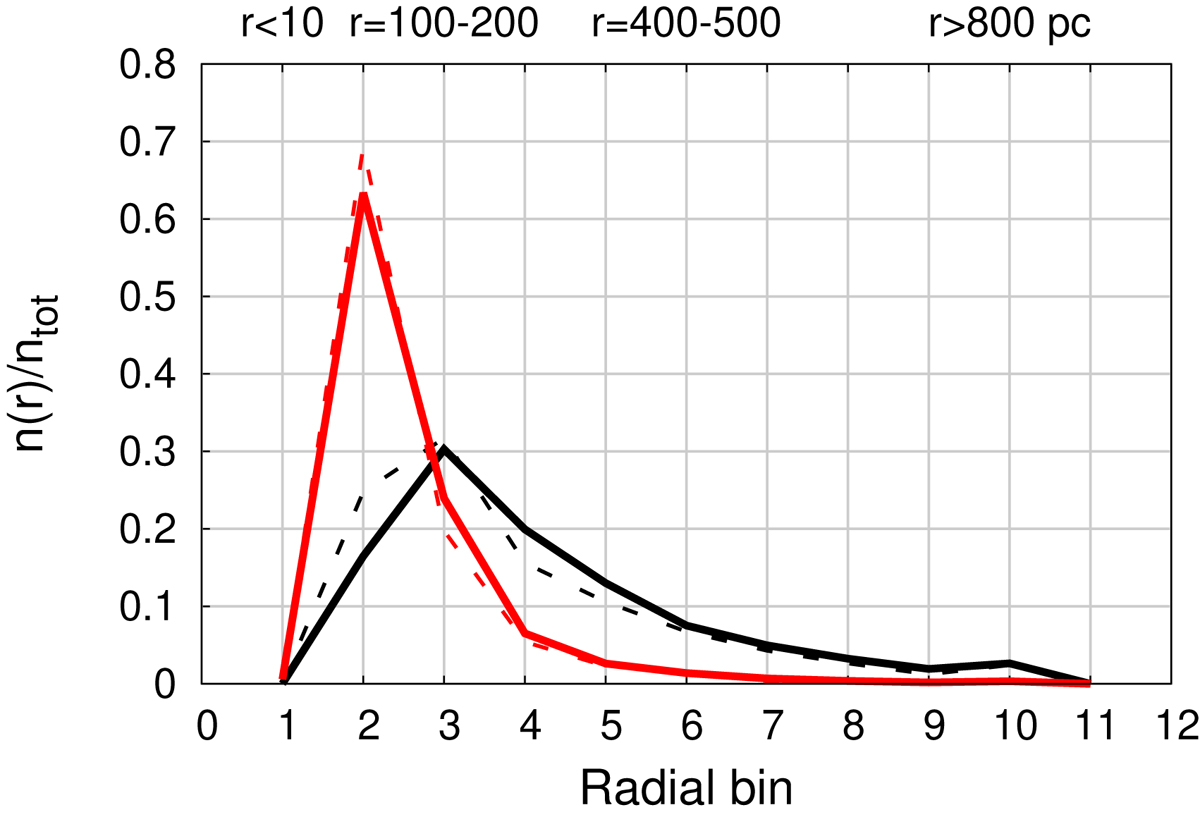
Relative numbers of OB associations in different radial bins for 1000 random placements of 4 (dashed lines) and 10 (solid lines) associations following a Plummer density profile with either a ≃ 200 (black lines) or 60 pc (red lines).
Current usage metrics show cumulative count of Article Views (full-text article views including HTML views, PDF and ePub downloads, according to the available data) and Abstracts Views on Vision4Press platform.
Data correspond to usage on the plateform after 2015. The current usage metrics is available 48-96 hours after online publication and is updated daily on week days.
Initial download of the metrics may take a while.