Fig. 8
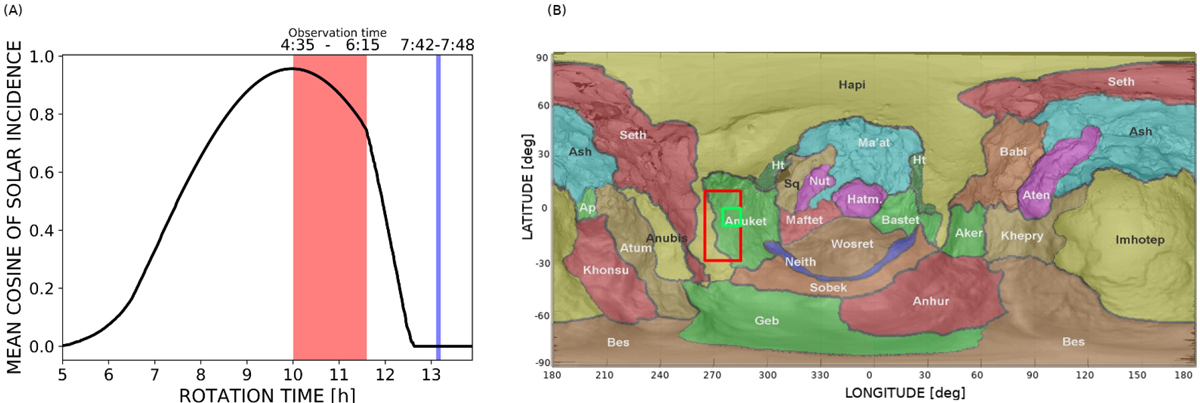
Panel A: mean cosine of the solar incidence angle vs. rotation time of the likely emitting region (Fig. 7): the red interval ranges from about 4:35 h to 6:15 h, the time span in which the likely emitting region is illuminated.We selected 4:35 h because it corresponds to the peak of the cosine plot, while 6:15 h corresponds to the moment in which the region starts to move into shadow. The blue interval represents the observation time of the dust plume (7:42–7:48 h). We note that during the dust plume, the emitting region is completely in shadow. Panel B: source region of the night-side dust activity detected by VM. The red rectangle indicates the emitting region calculated with the method described in the first part of Sect. 5, with a latitude ranging from − 30° to +10° and a longitude from 265 to 280°. The green rectangle indicates the source region constrained by measuring the length of the plume shadow. The region is mainly in the Anuket and Hapi regions.
Current usage metrics show cumulative count of Article Views (full-text article views including HTML views, PDF and ePub downloads, according to the available data) and Abstracts Views on Vision4Press platform.
Data correspond to usage on the plateform after 2015. The current usage metrics is available 48-96 hours after online publication and is updated daily on week days.
Initial download of the metrics may take a while.