Fig. 7
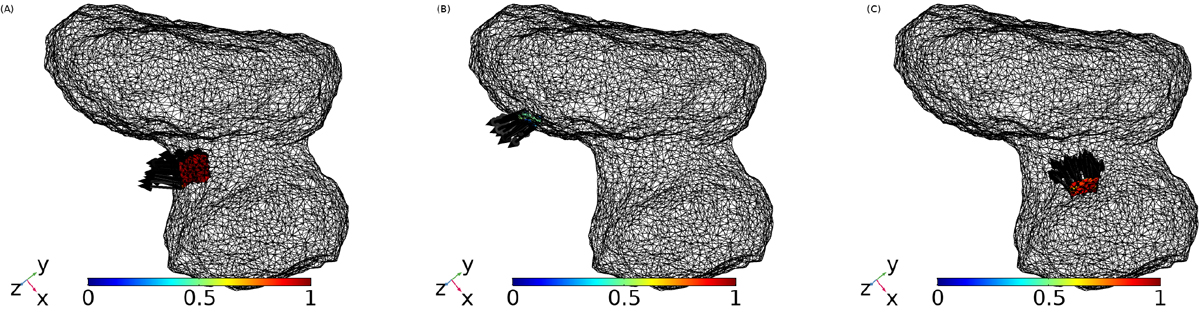
Definition of the normals (black lines) to the possible emitting regions by observing the illumination conditions of Fig. 6 at different local times. The color scale refers to the cosine of the solar incidence. Panel A: emitting region on the neck at 4:35 h (peak illumination), see panel A of Fig. 8. Panel B: another possible emitting region (in the head of the comet) at 6:16 h. Panel C: bottom region at 6:56 h. By observing the normal directions and comparing them with the emission of Fig. 2, the emitting region of panel A seems to be a more likely candidate.
Current usage metrics show cumulative count of Article Views (full-text article views including HTML views, PDF and ePub downloads, according to the available data) and Abstracts Views on Vision4Press platform.
Data correspond to usage on the plateform after 2015. The current usage metrics is available 48-96 hours after online publication and is updated daily on week days.
Initial download of the metrics may take a while.