Fig. 10
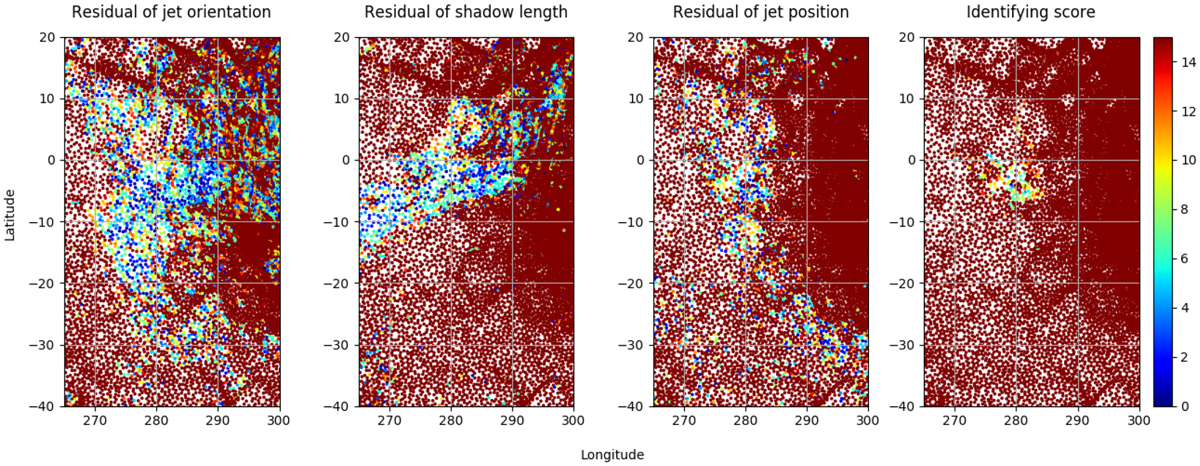
Simulation of the orientation, shadow length, and position of jets originating from the neck regions illuminated 1.75 h before the VIRTIS-M observations. Each point corresponds to the center of a facet in shape model version cg-dlr_ spg-shap7-v1.0, with 500 k facets. In the right panel, the score (see text) is plotted. Values of the score close to zero correspond to the best fit to the observations.
Current usage metrics show cumulative count of Article Views (full-text article views including HTML views, PDF and ePub downloads, according to the available data) and Abstracts Views on Vision4Press platform.
Data correspond to usage on the plateform after 2015. The current usage metrics is available 48-96 hours after online publication and is updated daily on week days.
Initial download of the metrics may take a while.