Fig. 6
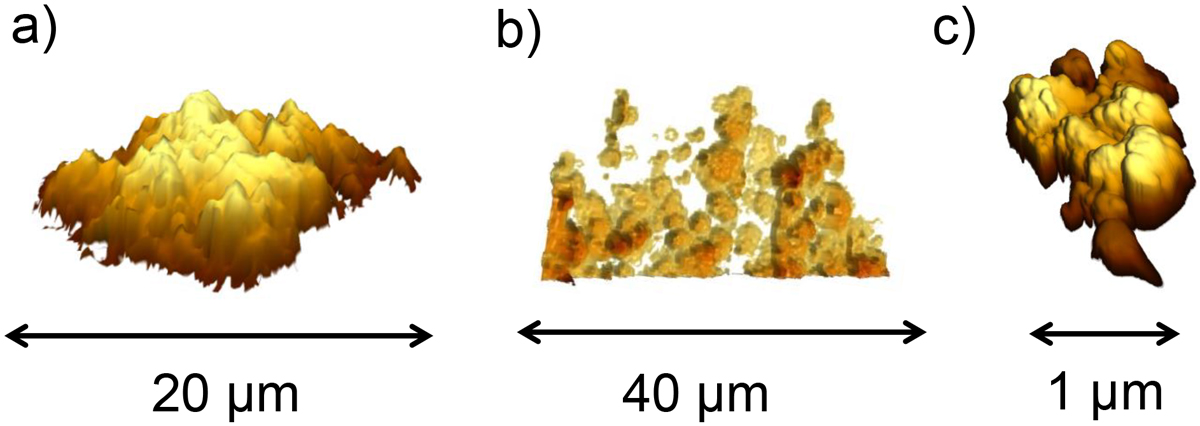
3D rendered images of MIDAS dust particles. Panel a: particle F as example for a large agglomerate particle whose subunits arepacked in a moderately dense fashion on the surface (Mannel et al. 2016). The source scan was taken on 14 October 2015 at 08:08:23 UTC with a resolution of 192 nm. Panel b: large porous agglomerate particle E. The data are taken from a scan on 18 January 2015 at 20:59:28 UTC with a resolution of 210 nm. Panel c: particle G, which is representative for the small particle class. The source scan was taken on 11 May 2016 at 12:08:03 UTC with a resolution of 8 nm and is shown in Figs. 2 and in Appendix D.2.
Current usage metrics show cumulative count of Article Views (full-text article views including HTML views, PDF and ePub downloads, according to the available data) and Abstracts Views on Vision4Press platform.
Data correspond to usage on the plateform after 2015. The current usage metrics is available 48-96 hours after online publication and is updated daily on week days.
Initial download of the metrics may take a while.