Fig. 5
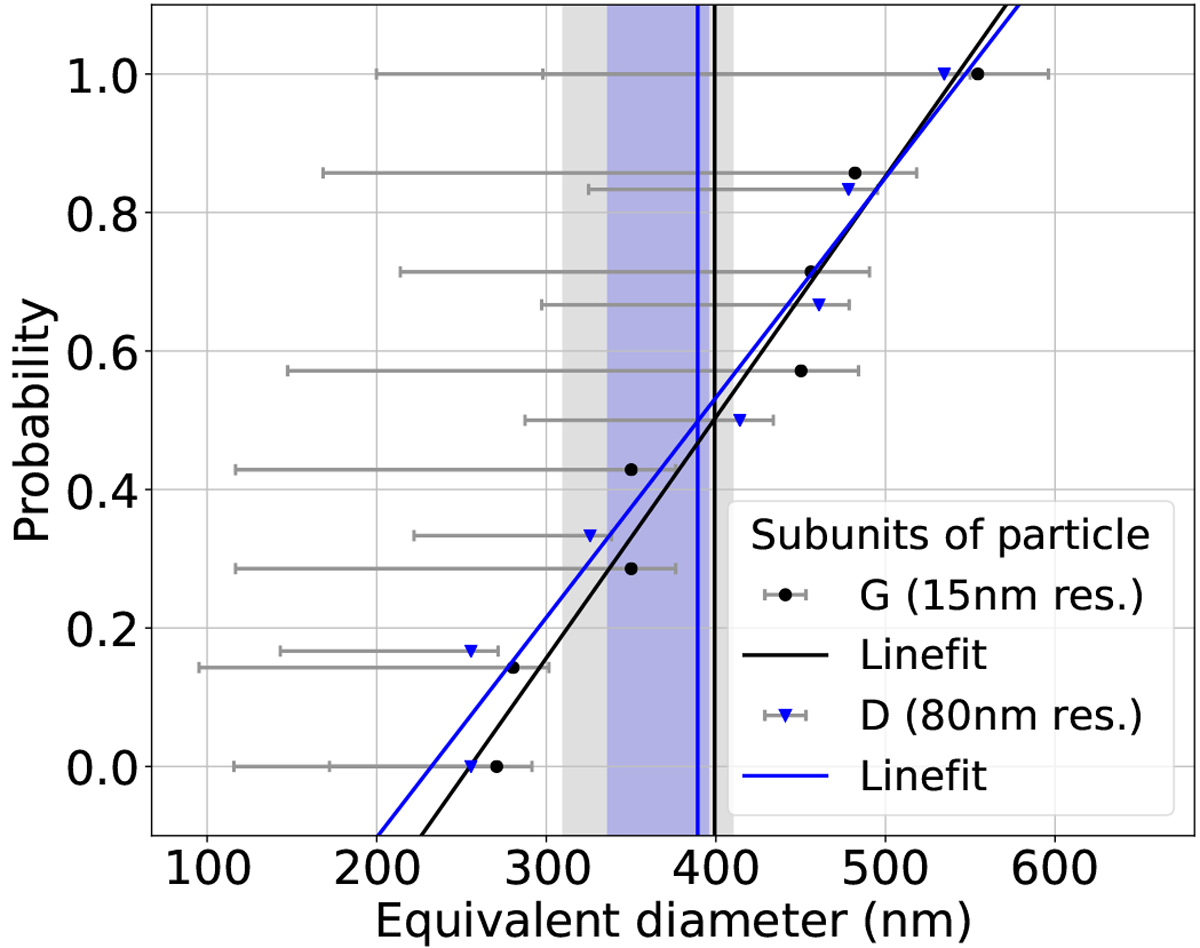
Cumulative size distribution of the larger subunits of particle G (Fig. 1b, black dots) and D (Bentley et al. 2016b, blue triangles). The line fits of the data are shown for particle G in black and particle D in blue, and the arithmetic means of the measured sizes are given as vertical lines with shaded uncertainty intervals.
Current usage metrics show cumulative count of Article Views (full-text article views including HTML views, PDF and ePub downloads, according to the available data) and Abstracts Views on Vision4Press platform.
Data correspond to usage on the plateform after 2015. The current usage metrics is available 48-96 hours after online publication and is updated daily on week days.
Initial download of the metrics may take a while.