Fig. 3
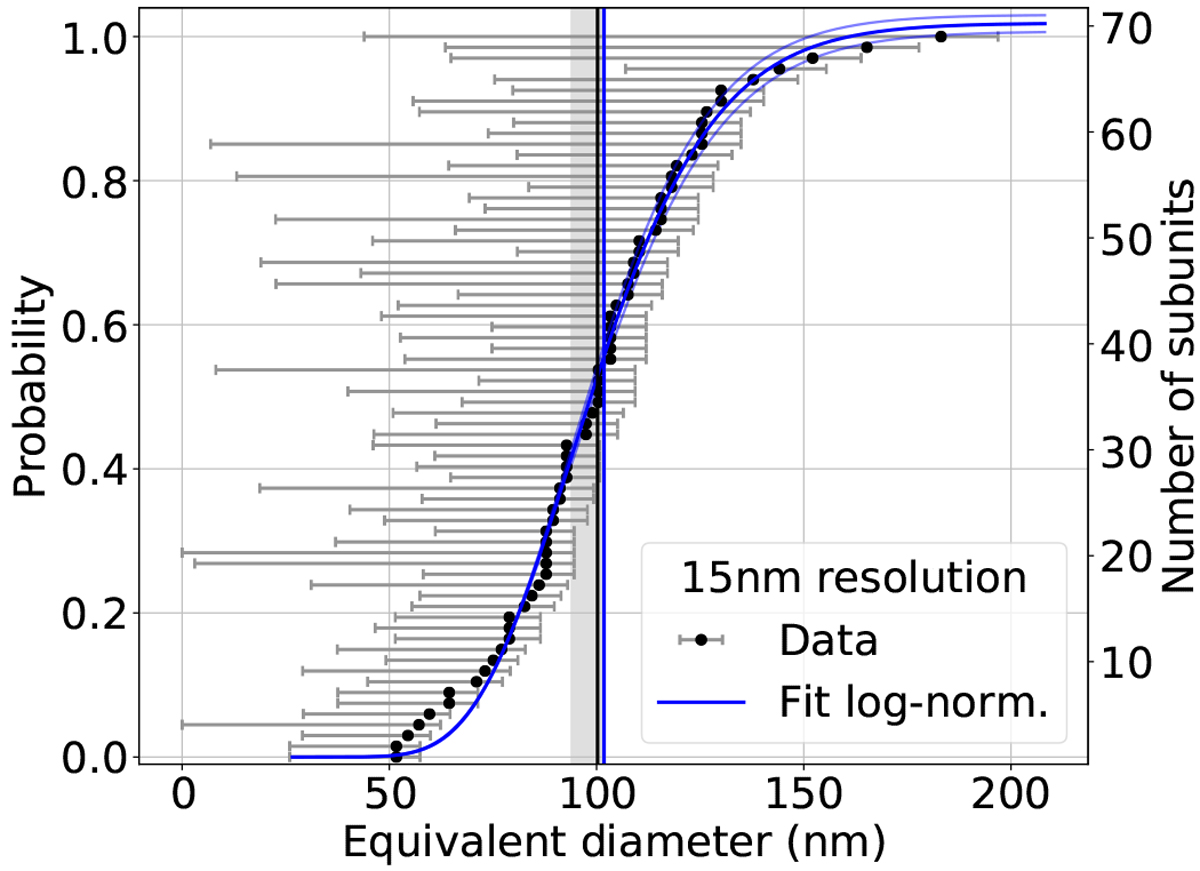
Cumulative size distribution of the subunits of particle G identified in the 15 nm resolution scan (Fig. 1c). On the left we show the probability that a subunit is smaller than the indicated value, and on the right we show the number of detected subunits. The log-normal fit is shown in blue together with its uncertainty interval in light blue. The verticallines denote the arithmetic (black) and fitted (blue) mean values with shaded uncertainty intervals.
Current usage metrics show cumulative count of Article Views (full-text article views including HTML views, PDF and ePub downloads, according to the available data) and Abstracts Views on Vision4Press platform.
Data correspond to usage on the plateform after 2015. The current usage metrics is available 48-96 hours after online publication and is updated daily on week days.
Initial download of the metrics may take a while.