Free Access
Fig. 2
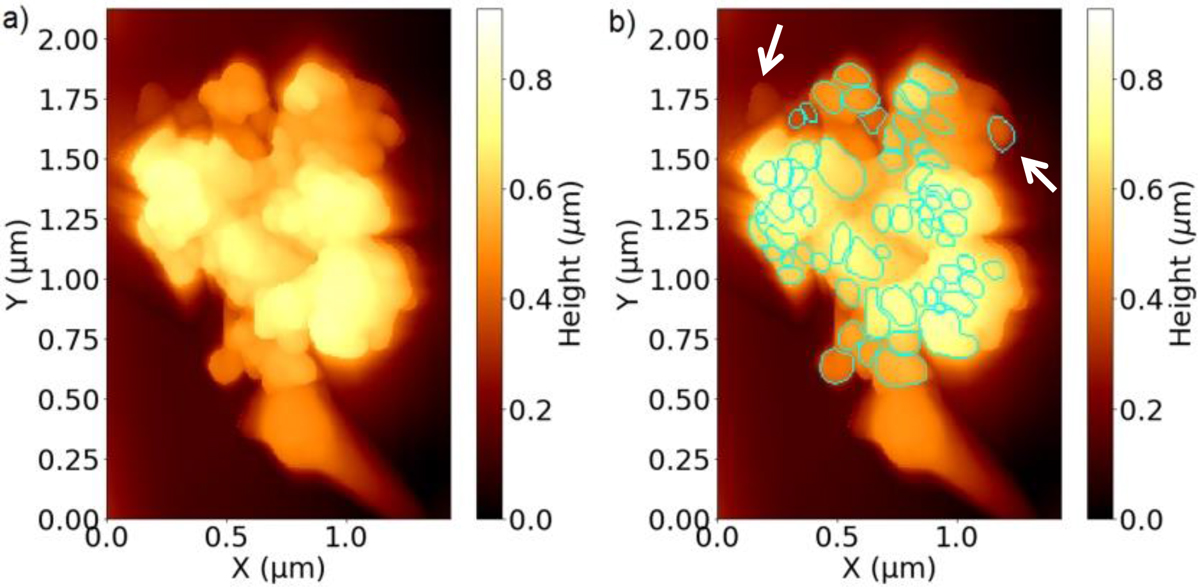
Same 1 μm particle G as shown in Fig. 1, but this time scanned with a resolution of 8 nm on 11 May 2016. Panel a: particle itself. Panel b: smallest identifiable features. Compared to Fig. 1, the color scale has to be fully exploited as some lower-lying subunits were imaged (indicated by the white arrows).
Current usage metrics show cumulative count of Article Views (full-text article views including HTML views, PDF and ePub downloads, according to the available data) and Abstracts Views on Vision4Press platform.
Data correspond to usage on the plateform after 2015. The current usage metrics is available 48-96 hours after online publication and is updated daily on week days.
Initial download of the metrics may take a while.