Fig. 10
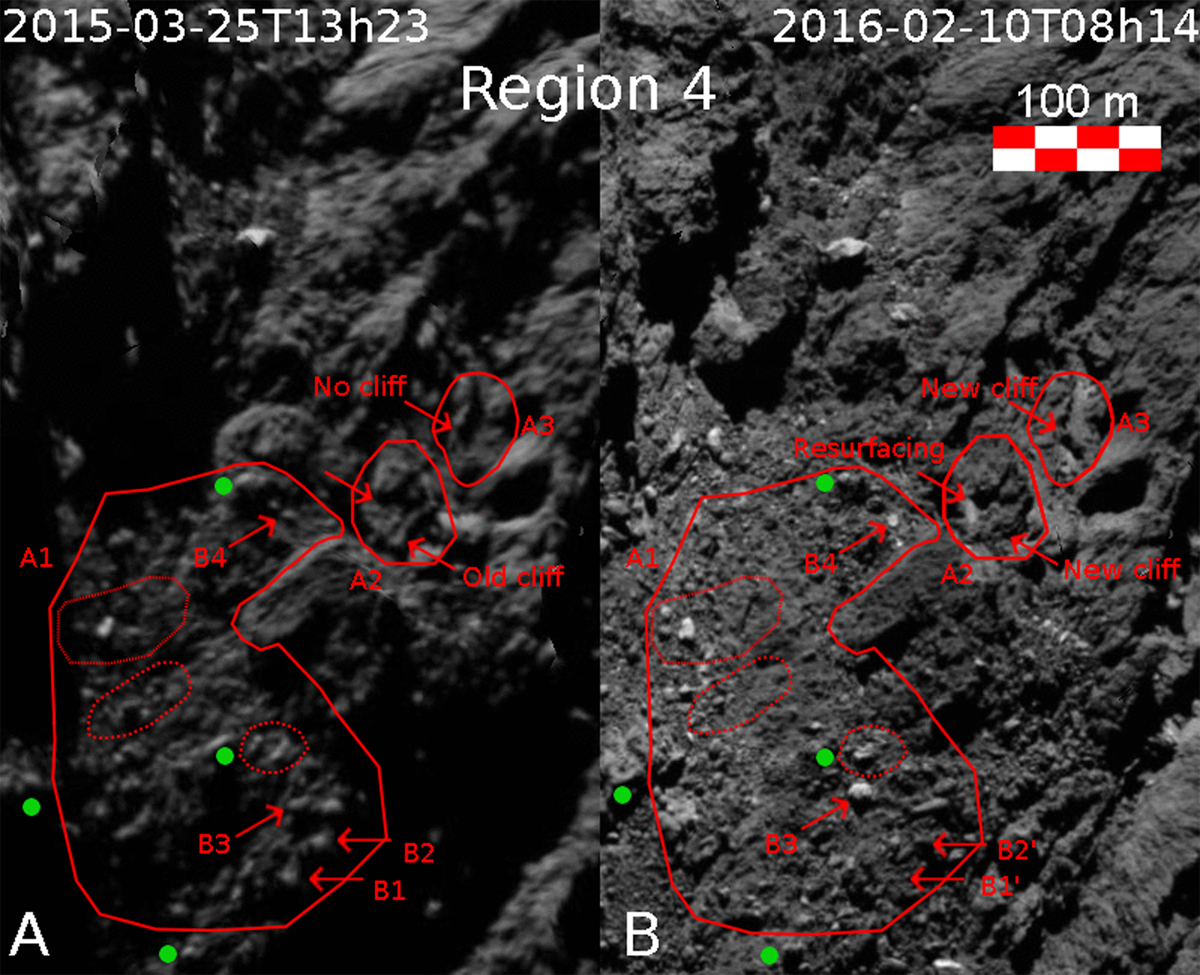
Region 4 in Fig. 1 in Anhur (from images acquired with the orange filter on 25 March 2015 (left) and 10 February 2016 (right). The March 2015 image has a lower spatial resolution (1.7 m px−1) than that in 2016 (1 m px−1), and it is reprojected onto the shape model to match the observing conditions of the February 2016 image. Thus the left- and right-side images have the same spatial scale. Changes are observed within the A1–A3 polygons, notably a cliff retreat in A2 area and a new cliff in area A3, as well as in the location and appearance of boulders B1–B4. See the online movie, which shows the morphological changes between these two epochs.
Current usage metrics show cumulative count of Article Views (full-text article views including HTML views, PDF and ePub downloads, according to the available data) and Abstracts Views on Vision4Press platform.
Data correspond to usage on the plateform after 2015. The current usage metrics is available 48-96 hours after online publication and is updated daily on week days.
Initial download of the metrics may take a while.