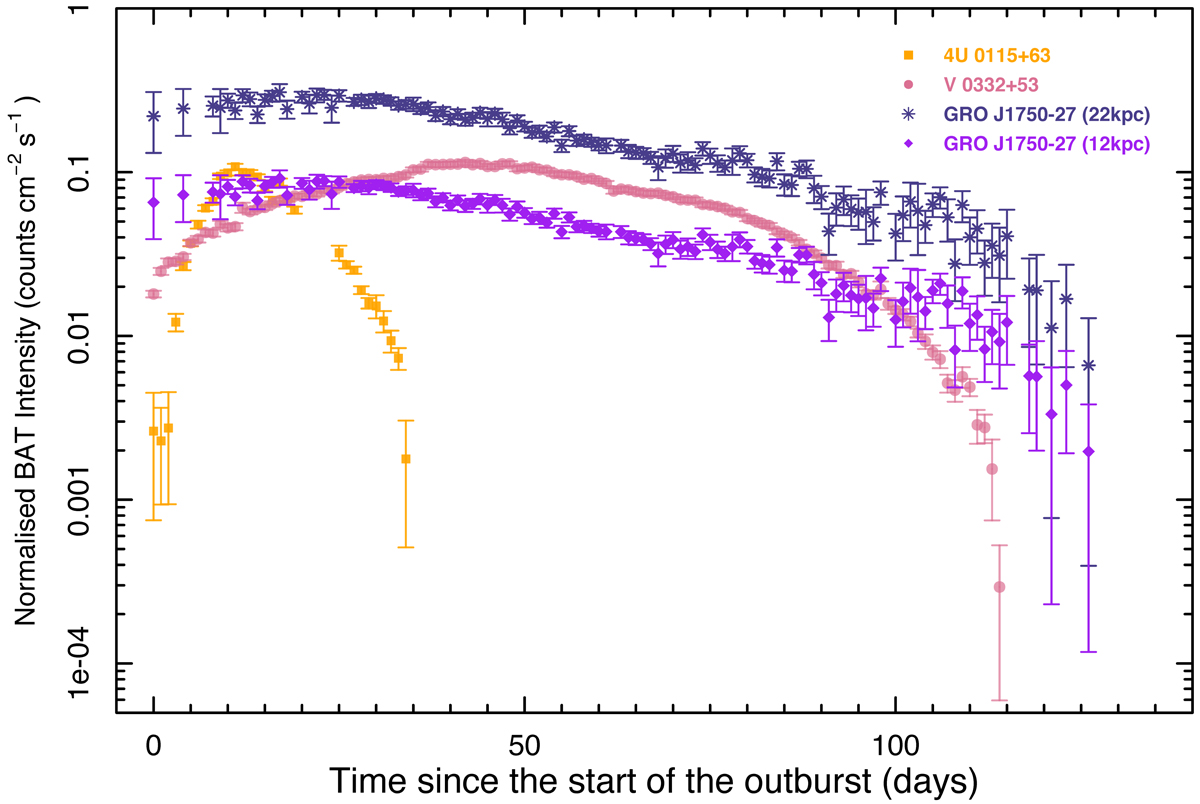
Fig. 5.

Swift/BAT light curves (in the energy range 15–50 keV) of the three Be/X-ray transients discussed in the paper. The orange squares correspond to 4U 0115+63, the pink circles to V 0332+53, the dark stars to GRO J1750−27 assuming that the source is located at a distance of 22 kpc, and the purple diamonds correspond to GRO J1750−27 for an assumed distance of 12 kpc. The BAT count rates of the three sources have been normalised to a distance of 7 kpc using the best estimates for the true source distances (see Table 1). The start times of the different outbursts are listed in Table 1.
Current usage metrics show cumulative count of Article Views (full-text article views including HTML views, PDF and ePub downloads, according to the available data) and Abstracts Views on Vision4Press platform.
Data correspond to usage on the plateform after 2015. The current usage metrics is available 48-96 hours after online publication and is updated daily on week days.
Initial download of the metrics may take a while.


