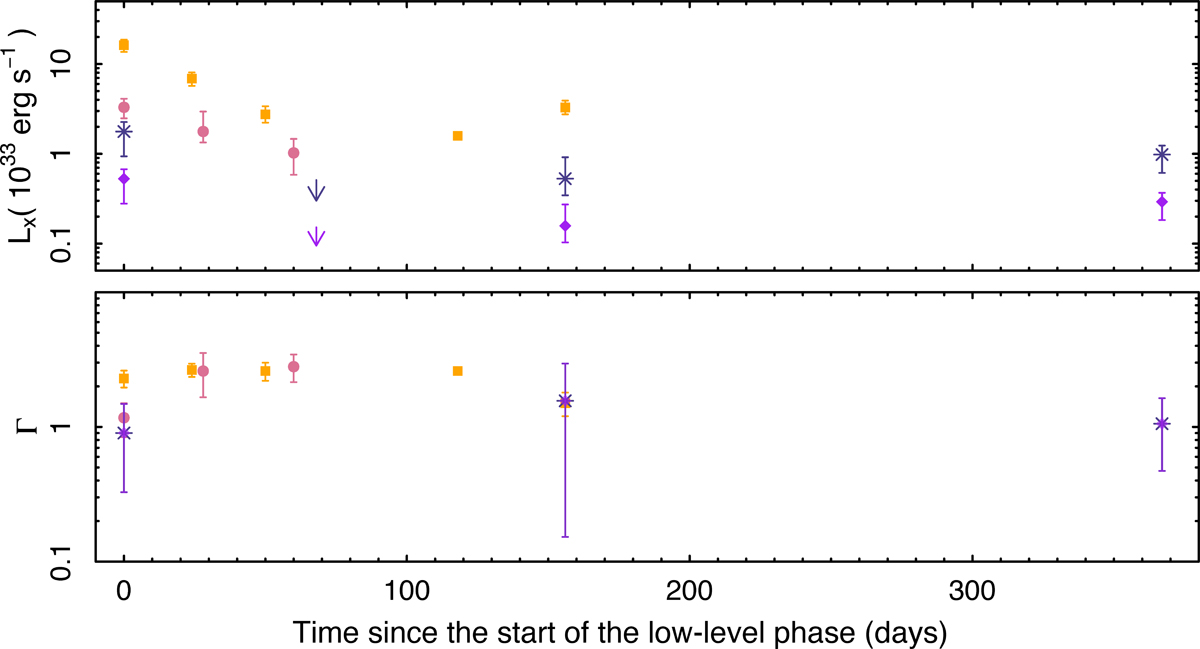
Fig. 4.

Evolution (using a power-law model) of the spectral parameters: the X-ray luminosity (for the energy range 0.5–10 keV; top panel) and the photon index (bottom panel). The colours and symbols represent the same sources as in Fig. 3. Errors are 1σ. Some points of 4U 0115+63 and V 0332+53 are plotted with symbols that are larger than the corresponding error bars of these points. The arrows indicate upper limits on the luminosity and are calculated using the method described in Sect. 2.3.
Current usage metrics show cumulative count of Article Views (full-text article views including HTML views, PDF and ePub downloads, according to the available data) and Abstracts Views on Vision4Press platform.
Data correspond to usage on the plateform after 2015. The current usage metrics is available 48-96 hours after online publication and is updated daily on week days.
Initial download of the metrics may take a while.


