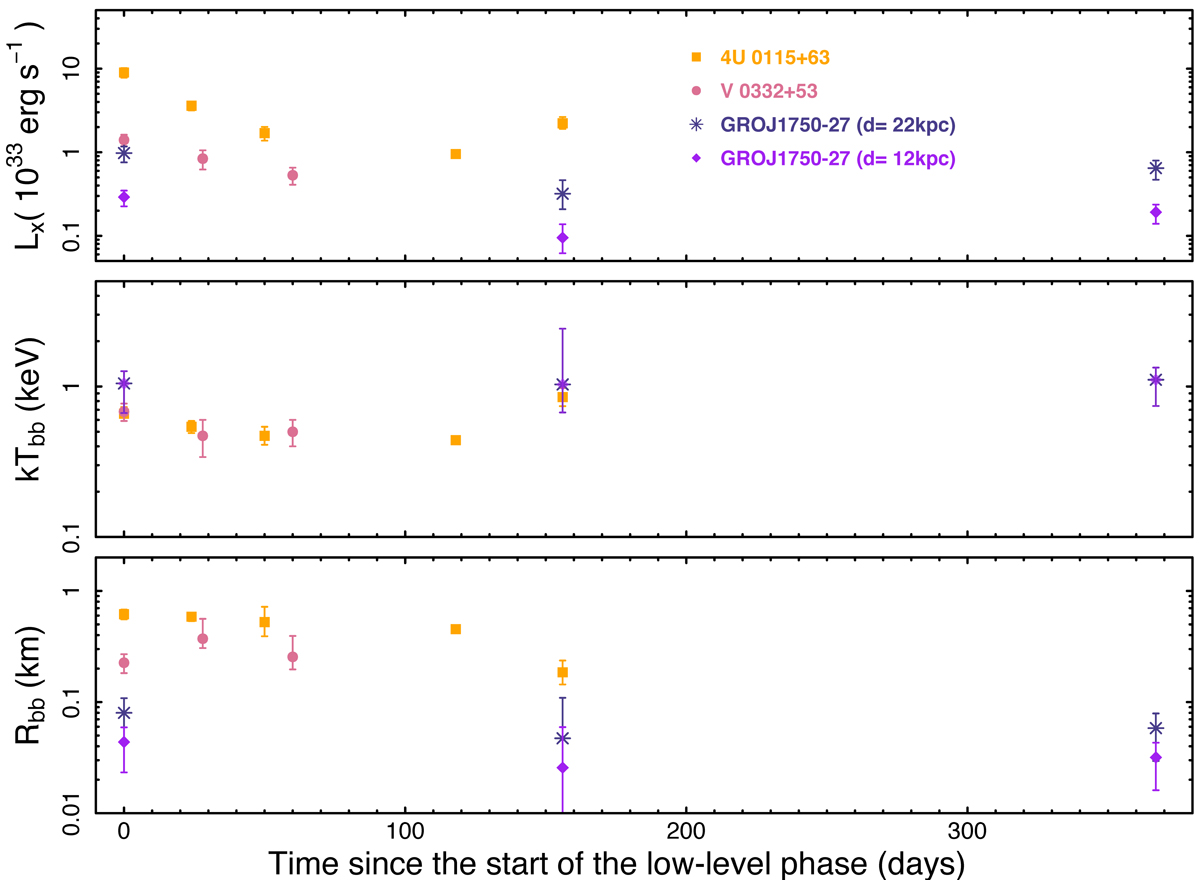
Fig. 3.

Evolution (using a blackbody model) of the spectral parameters (from the top to the bottom): the X-ray luminosity (for the energy range 0.5–10 keV), the blackbody temperature, and the associated emission radius. The orange squares are the Swift/XRT spectral results of 4U 0115+63 published by Wijnands & Degenaar (2016) and Rouco Escorial et al. (2017). The pink circles correspond to the Swift/XRT spectral results of V 0332+53 reported by Wijnands & Degenaar (2016). Luminosities and emission region radii from both sources have been recalculated using their new Gaia distances as given in Table 3. The dark stars and purple diamonds are our Chandra spectral results of GRO J1750−27 when assuming a source distance of 22 kpc or 12 kpc, respectively. Errors are 1σ. Some points of 4U 0115+63 and V 0332+53 are plotted with symbols that are larger than the corresponding error bars of these points.
Current usage metrics show cumulative count of Article Views (full-text article views including HTML views, PDF and ePub downloads, according to the available data) and Abstracts Views on Vision4Press platform.
Data correspond to usage on the plateform after 2015. The current usage metrics is available 48-96 hours after online publication and is updated daily on week days.
Initial download of the metrics may take a while.


