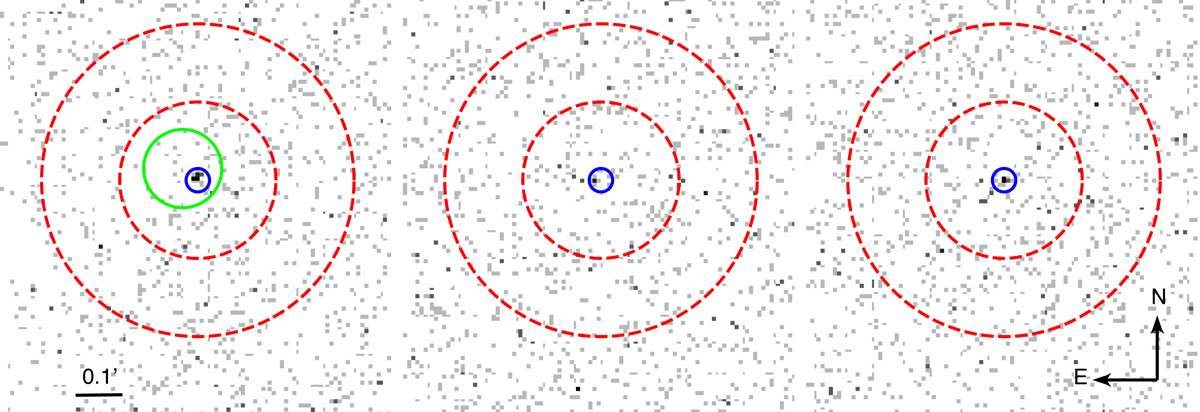
Fig. 2.

Close-up images (0.5–7 keV energy range) of our Chandra detections (listed by their ObsIDs; from left to right): 16723, 16725 and 16726. The blue circles indicate the source extraction regions and the dashed red annuli the background extraction regions. The green circle is the Swift/XRT error region of the source reported by Shaw et al. (2009). See Sects. 2.1 and 2.2 for more details about the detections and upper limits.
Current usage metrics show cumulative count of Article Views (full-text article views including HTML views, PDF and ePub downloads, according to the available data) and Abstracts Views on Vision4Press platform.
Data correspond to usage on the plateform after 2015. The current usage metrics is available 48-96 hours after online publication and is updated daily on week days.
Initial download of the metrics may take a while.


