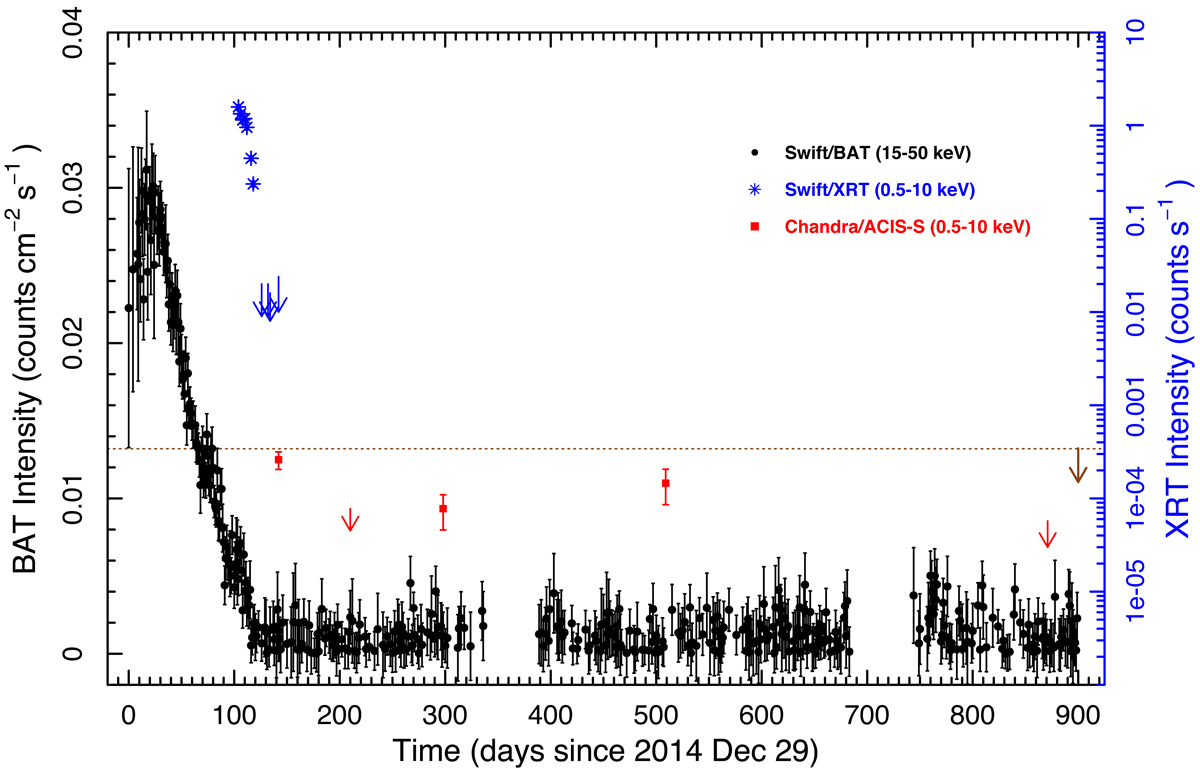
Fig. 1.

Swift/XRT (blue) and Swift/BAT (black) light curves during and after the 2015 type-II outburst of GRO J1750−27. All Chandra count rates have been converted to Swift/XRT count rates using the method described in Sect. 2.1. The Chandra detections (with 1σ errors) are given as red squares. The Chandra upper limits are determined in the manner explained in Sect. 2.1 and shown as red arrows. The dotted brown line and brown arrow represent the upper limit obtained in the Chandra observation 14643 taken in May 2013, i.e., almost a year and a half before the 2015 type-II outburst. The zeropoint of the light curve (the fiducial starting point of the outburst) corresponds to December 29th, 2014.
Current usage metrics show cumulative count of Article Views (full-text article views including HTML views, PDF and ePub downloads, according to the available data) and Abstracts Views on Vision4Press platform.
Data correspond to usage on the plateform after 2015. The current usage metrics is available 48-96 hours after online publication and is updated daily on week days.
Initial download of the metrics may take a while.


