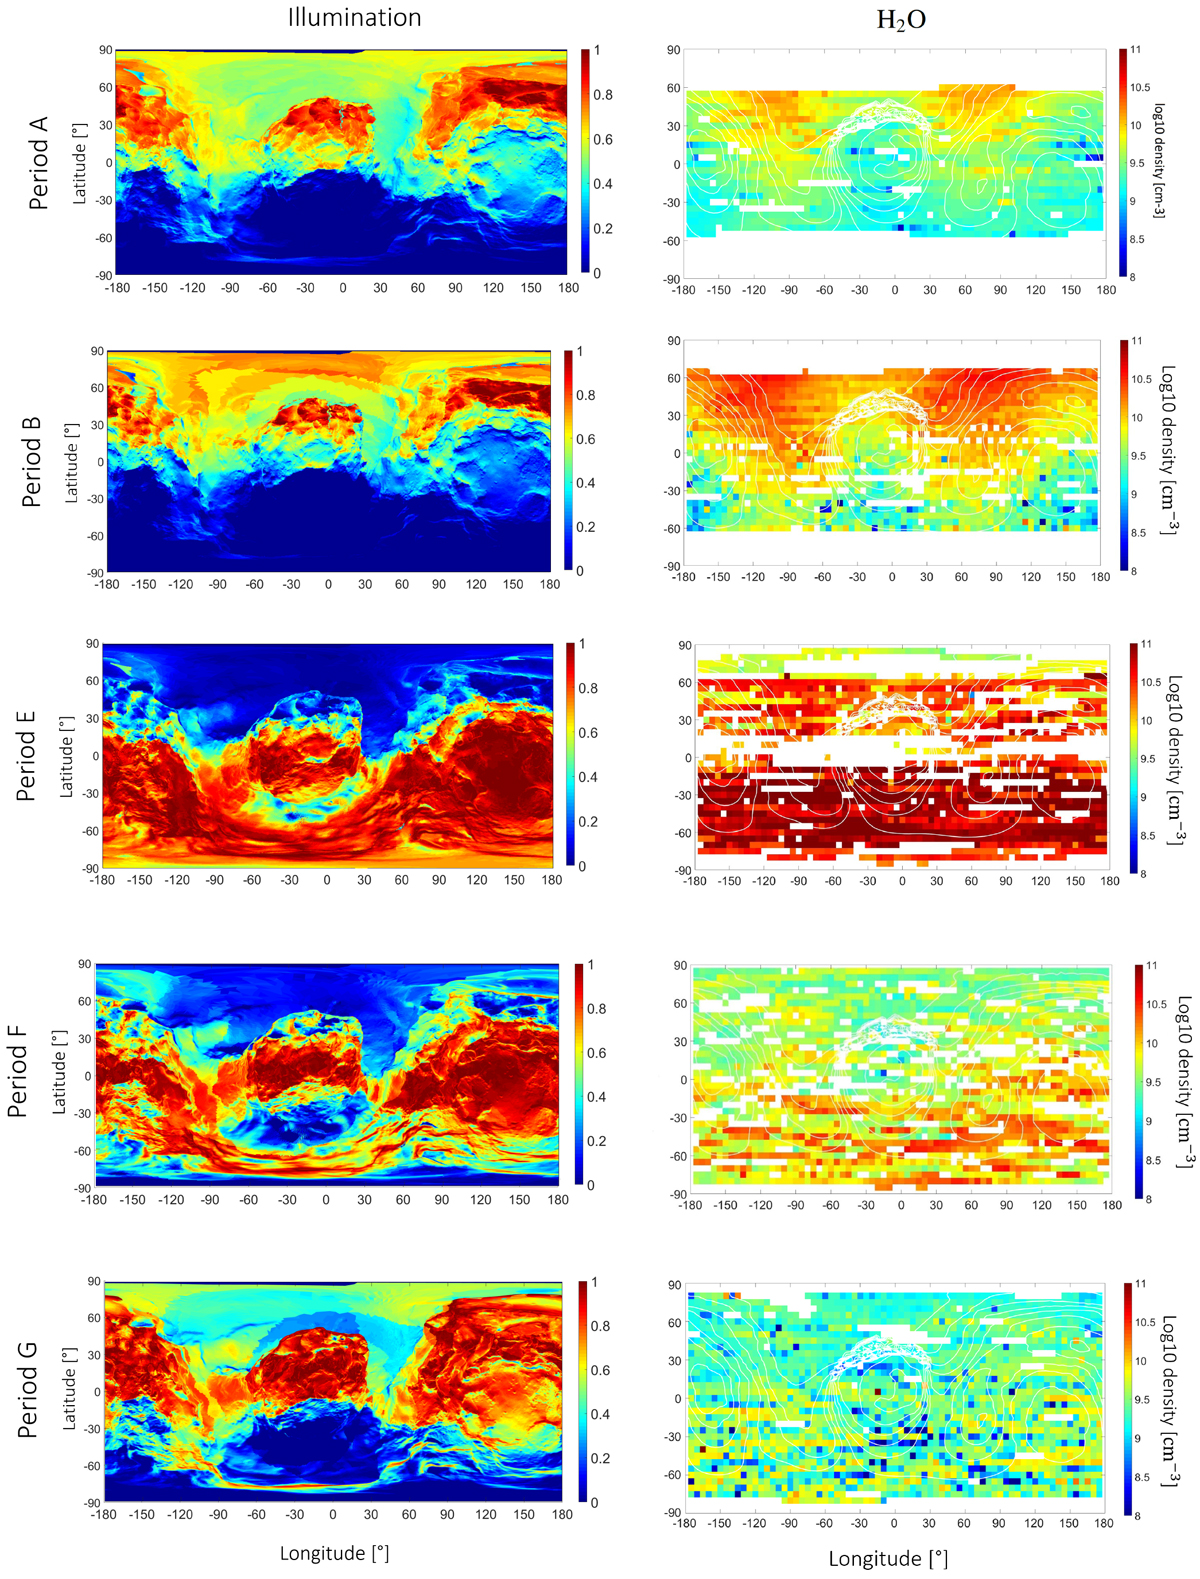
Fig. 5

Left: 2D maps of the average illumination of the surface during the periods A, B, E, F, and G described in Table 1, based on the average subsolar latitude and the heliocentric distance. Colors give the normalized intensity, maxima in red and minima in blue. Right: spatial heterogeneities of RTOF H2O number densities (log 10) in cm−3 projected onto the SSC point, and scaled to a distance of 1 km from the center of the nucleus, for the seven periods (see Table 1).
Current usage metrics show cumulative count of Article Views (full-text article views including HTML views, PDF and ePub downloads, according to the available data) and Abstracts Views on Vision4Press platform.
Data correspond to usage on the plateform after 2015. The current usage metrics is available 48-96 hours after online publication and is updated daily on week days.
Initial download of the metrics may take a while.


