Fig. 2.
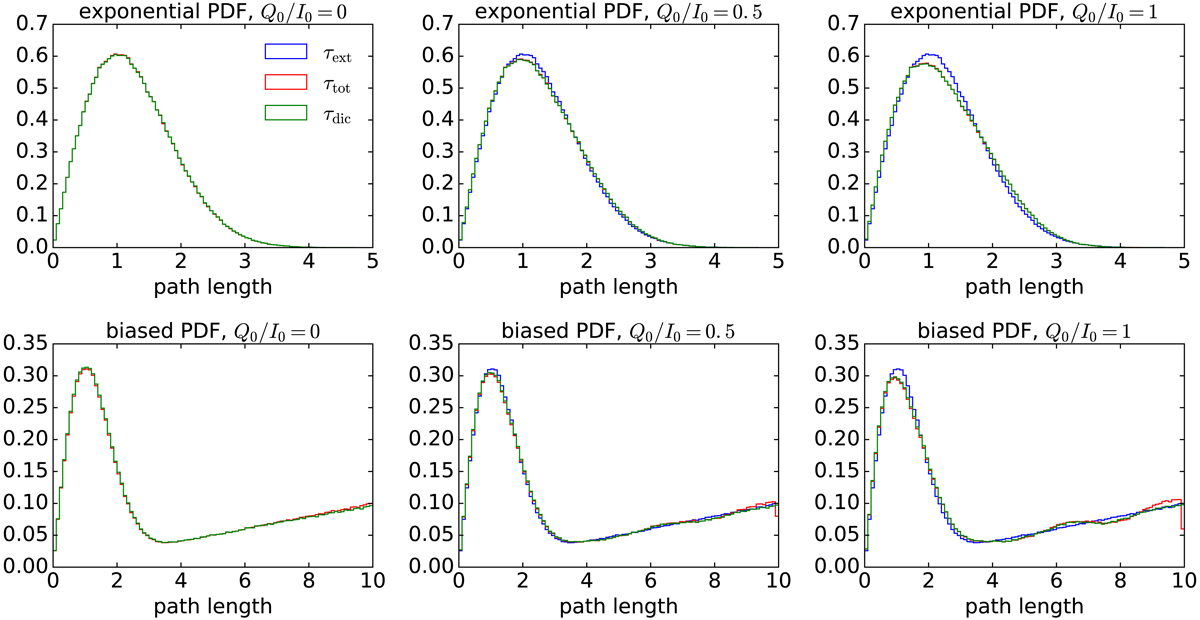
Histograms for distribution of randomly generated path lengths, corresponding to different optical depth scales discussed in this paper. The model is described in Sect. 4.1, and the different columns correspond to different levels of initial linear polarisation. Top panels: optical depths randomly generated from an exponential distribution, bottom panels: optical depths generated by using the composite biasing approach discussed in Baes et al. (2016).
Current usage metrics show cumulative count of Article Views (full-text article views including HTML views, PDF and ePub downloads, according to the available data) and Abstracts Views on Vision4Press platform.
Data correspond to usage on the plateform after 2015. The current usage metrics is available 48-96 hours after online publication and is updated daily on week days.
Initial download of the metrics may take a while.