Fig. 9
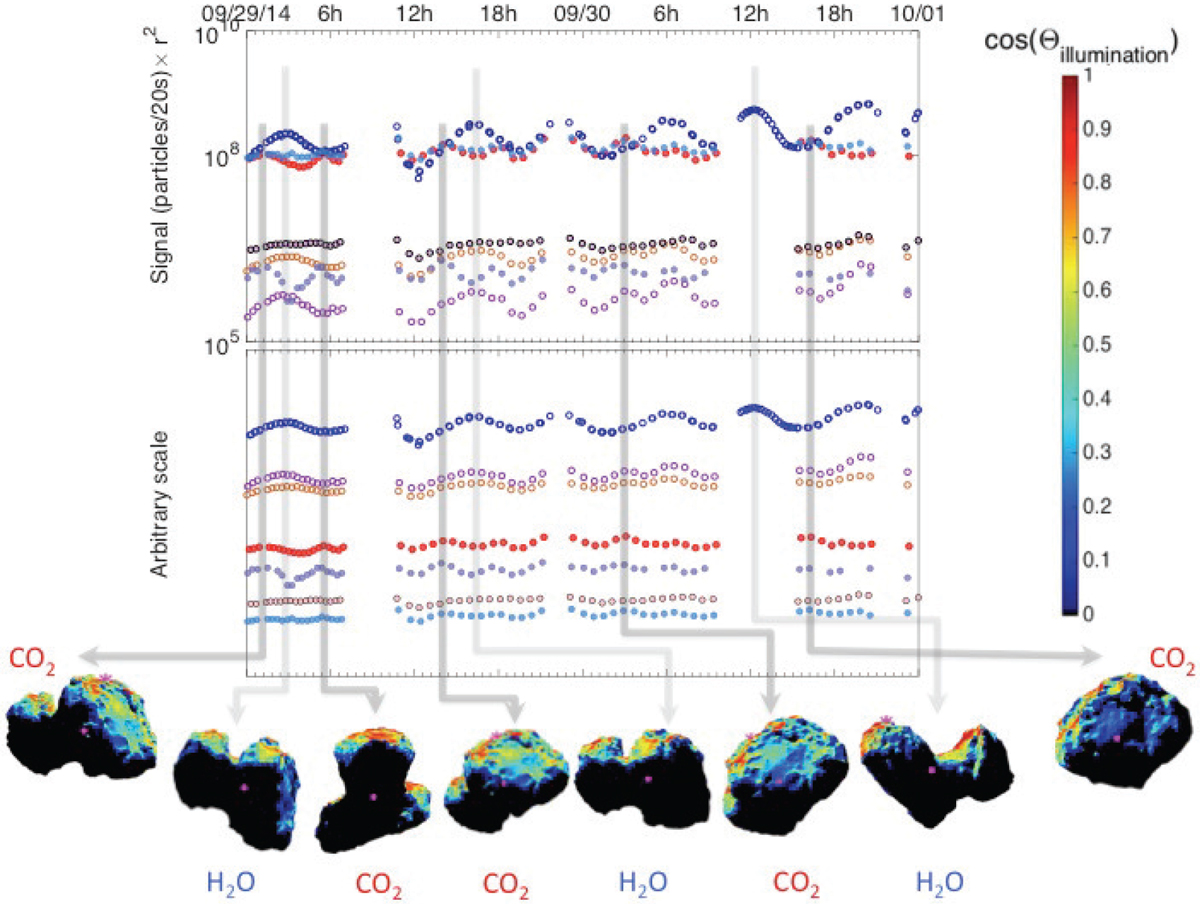
Snapshots of the pre-equinox spacecraft view of 67P at the times of signal maxima with the rough illumination (the cosine between the surface normal and the direction of the Sun). Top: signal corrected for r2. Bottom: shifted signal according to volatility. Light gray arrows indicate H2O, while darker gray arrows indicate CO2 maxima. Shape model: ESA NAVCAM.
Current usage metrics show cumulative count of Article Views (full-text article views including HTML views, PDF and ePub downloads, according to the available data) and Abstracts Views on Vision4Press platform.
Data correspond to usage on the plateform after 2015. The current usage metrics is available 48-96 hours after online publication and is updated daily on week days.
Initial download of the metrics may take a while.