Fig. 8
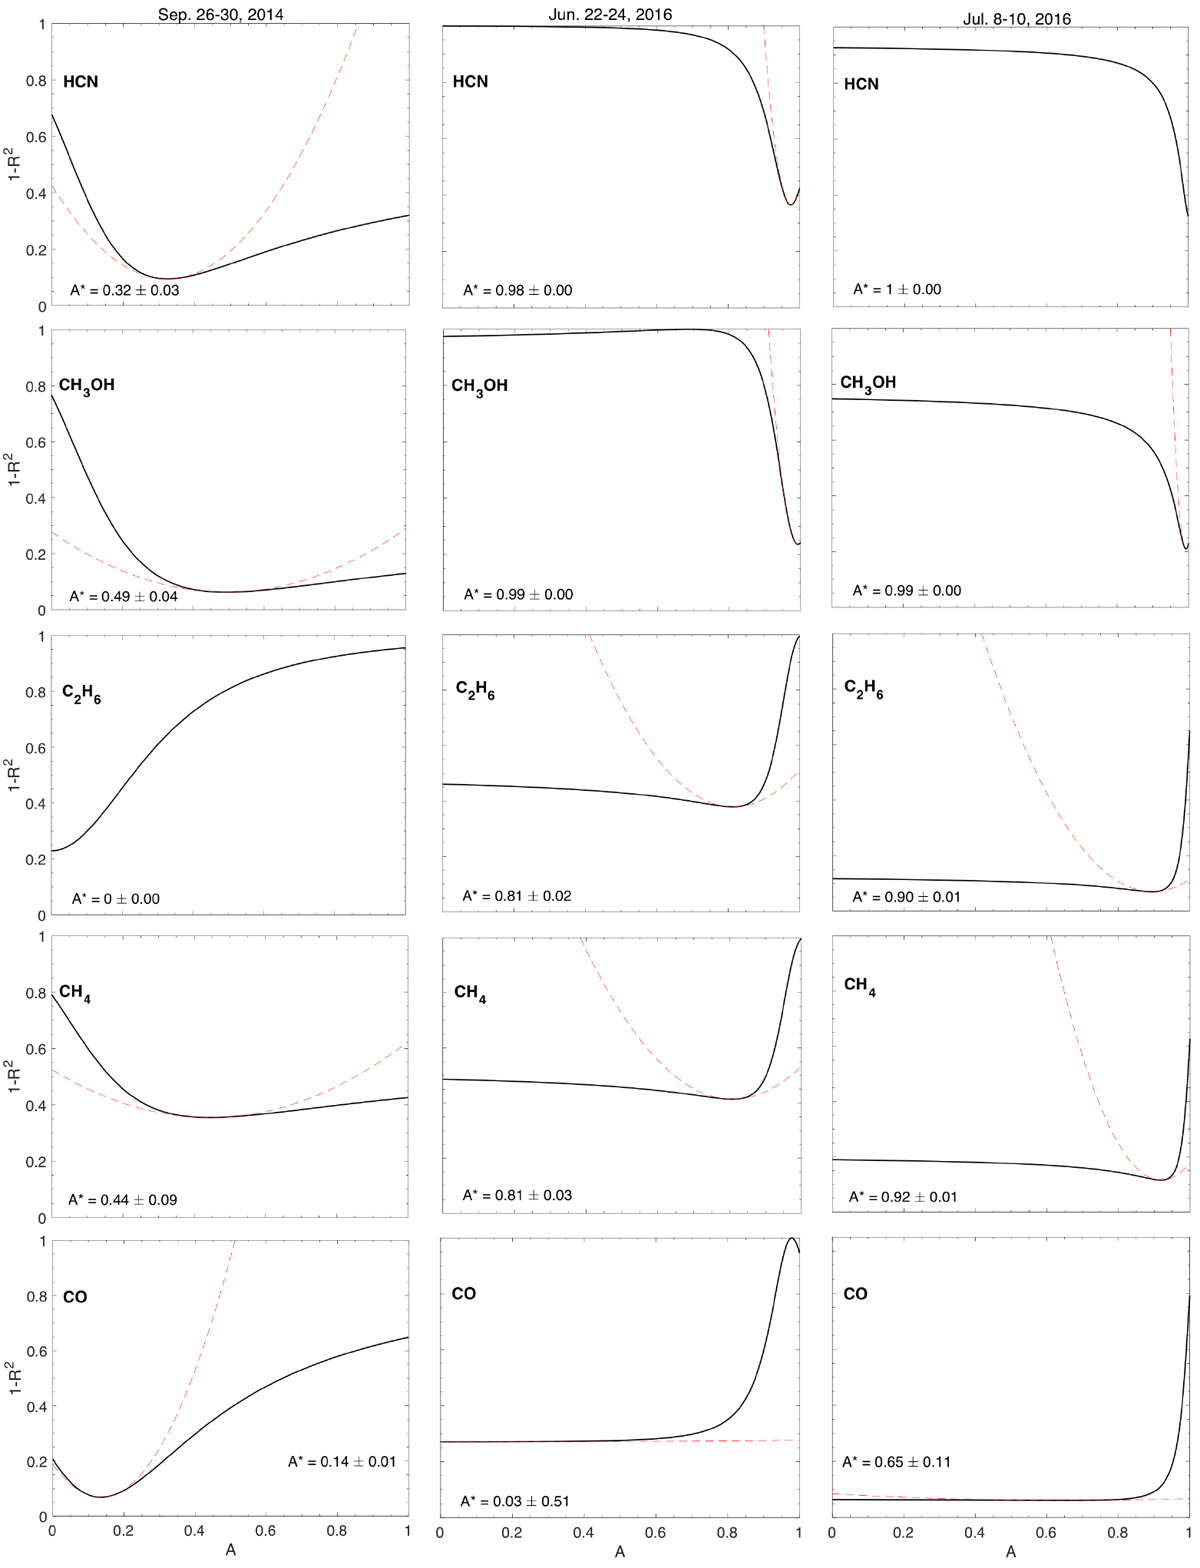
1− R2 vs. mole fraction (0 = pure CO2, 1 = pure H2O) for three species for the pre-equinox and the two post-equinox time periods. The dashed curves show a parabolic fit to peaks in 1 − R2. These fits provide an indication of the uncertainties in the range of mole fractions that produce the best fit (corresponding to the maximum correlation, i.e., the lowest 1 − R2, see Livadiotis & McComas 2013; Livadiotis 2007). Post-equinox, HCN correlates best with pure H2O. Pre- and post-equinox, C2H6 correlates best with CO2 because addition of H2O either makesthe correlation worse or does not change the correlation. CH4 is clearly different pre- and post-equinox. Pre-equinox, this species correlates better with pure H2O, but post equinox, the correlation is best with pure CO2. HCN pre-equinox is the only species that has a better correlation with a mix of CO2 and H2O.
Current usage metrics show cumulative count of Article Views (full-text article views including HTML views, PDF and ePub downloads, according to the available data) and Abstracts Views on Vision4Press platform.
Data correspond to usage on the plateform after 2015. The current usage metrics is available 48-96 hours after online publication and is updated daily on week days.
Initial download of the metrics may take a while.