Fig. 6
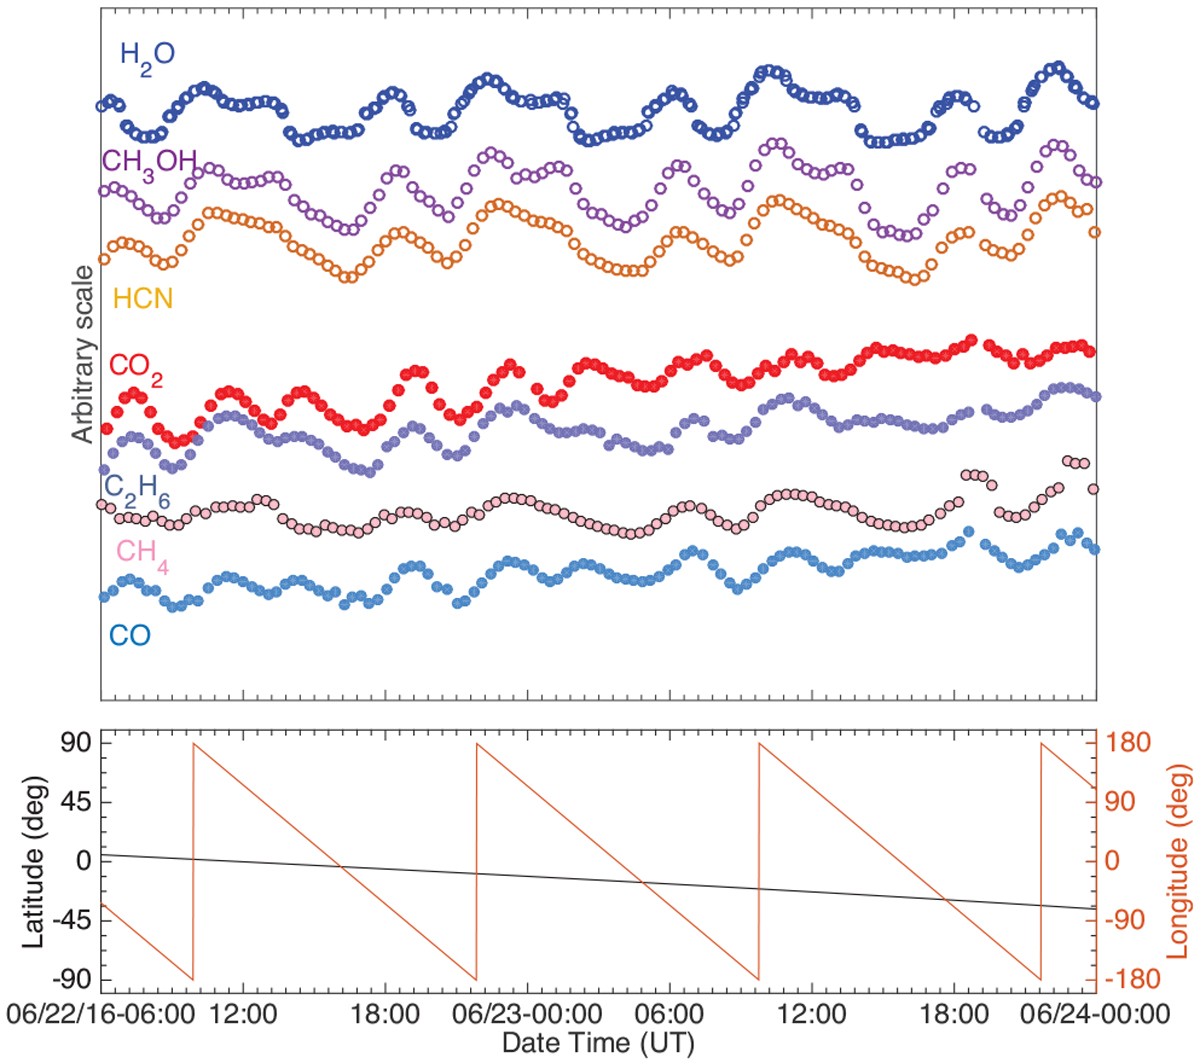
Profiles of major and minor species vs. time, shown on arbitrary scale for 22–24 June 2016. The separation of species into two groups (following H2O or CO2) based on their time variability profiles is clearly visible and is confirmed by the correlations listed in Table 2. CH3OH and HCN follow H2O closely, while C2H6, CH4 and CO follow CO2.
Current usage metrics show cumulative count of Article Views (full-text article views including HTML views, PDF and ePub downloads, according to the available data) and Abstracts Views on Vision4Press platform.
Data correspond to usage on the plateform after 2015. The current usage metrics is available 48-96 hours after online publication and is updated daily on week days.
Initial download of the metrics may take a while.