Free Access
Fig. 5
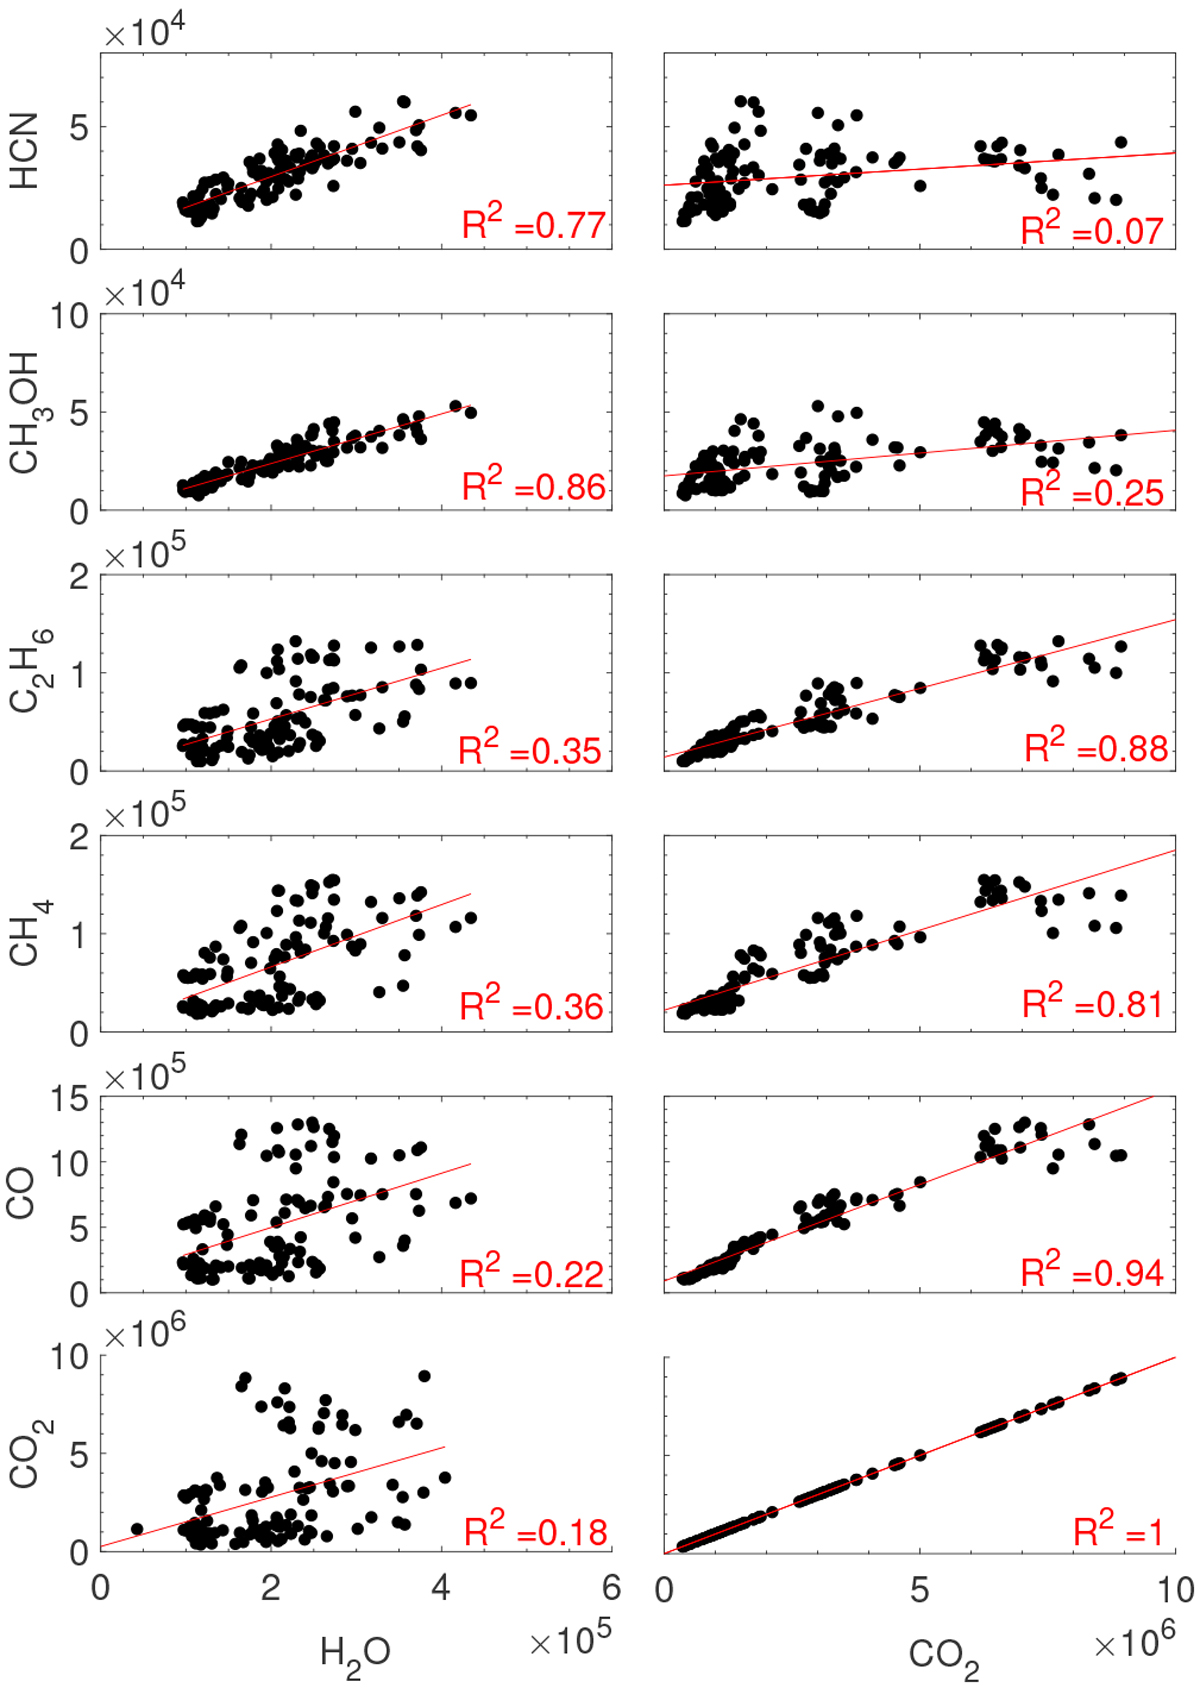
Scatter plots of the seven analyzed minor species against H2O (left) and CO2 (right) for 8–10 July 2016. Data are shown in units of particles/20 s. The linear regression line and the corresponding R2 values for each pair are also shown.
Current usage metrics show cumulative count of Article Views (full-text article views including HTML views, PDF and ePub downloads, according to the available data) and Abstracts Views on Vision4Press platform.
Data correspond to usage on the plateform after 2015. The current usage metrics is available 48-96 hours after online publication and is updated daily on week days.
Initial download of the metrics may take a while.