Fig. 1
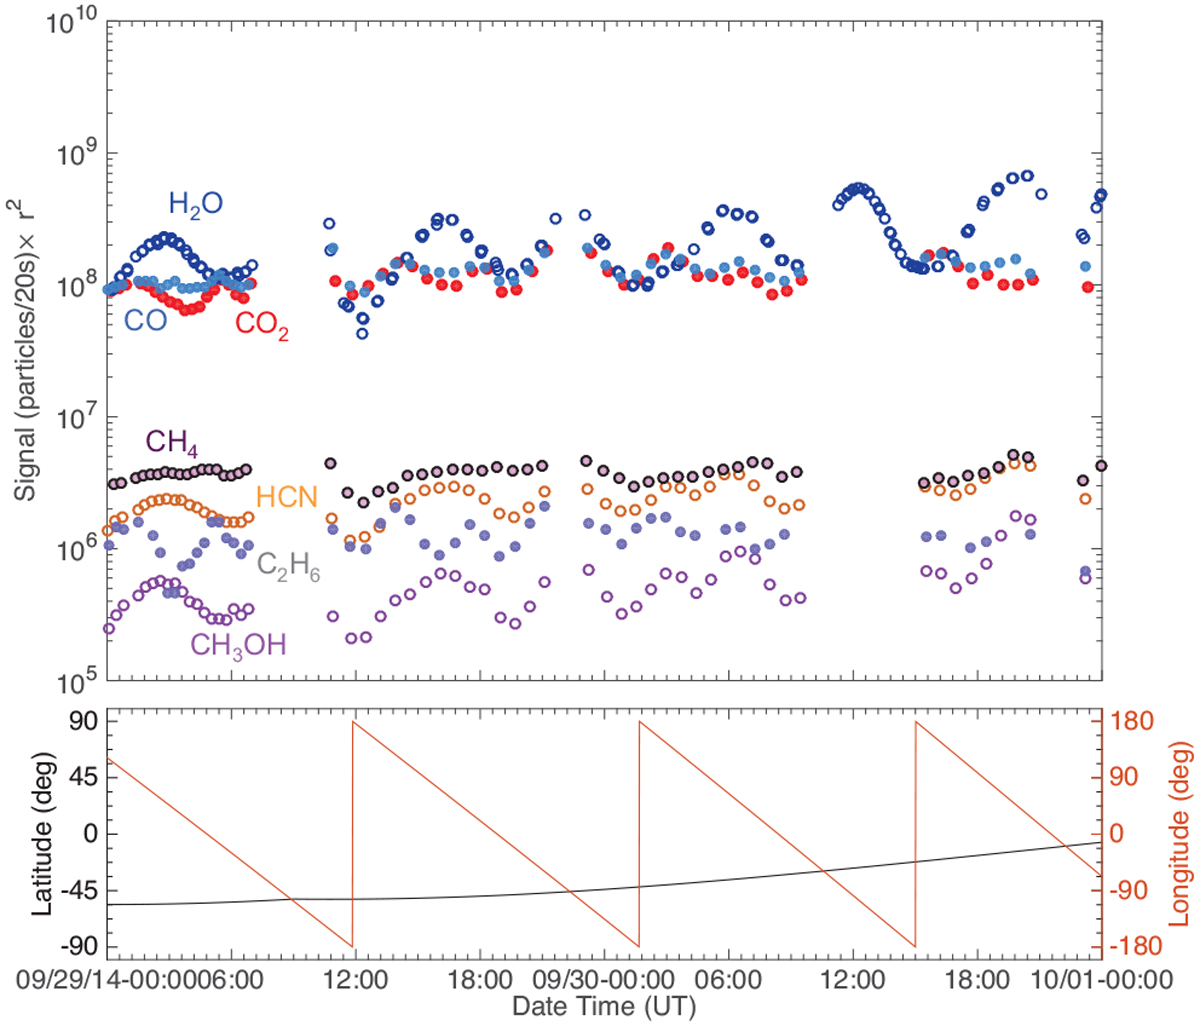
Top: typical pre-inbound-equinox (29–30 September 2014) southern hemisphere time variation of the seven studied species for a time period analyzed in Luspay-Kuti et al. (2015). The signal has beenscaled to the distance of Rosetta from the center of the nucleus (i.e., multiplied by r2). Species that trend together are illustrated with empty and filled markers. Bottom: corresponding sub-spacecraft longitude (red) and latitude (black). Errors are smaller than the marker size. Plot shown for comparative purposes with post-outbound-equinox data.
Current usage metrics show cumulative count of Article Views (full-text article views including HTML views, PDF and ePub downloads, according to the available data) and Abstracts Views on Vision4Press platform.
Data correspond to usage on the plateform after 2015. The current usage metrics is available 48-96 hours after online publication and is updated daily on week days.
Initial download of the metrics may take a while.