Fig. 8
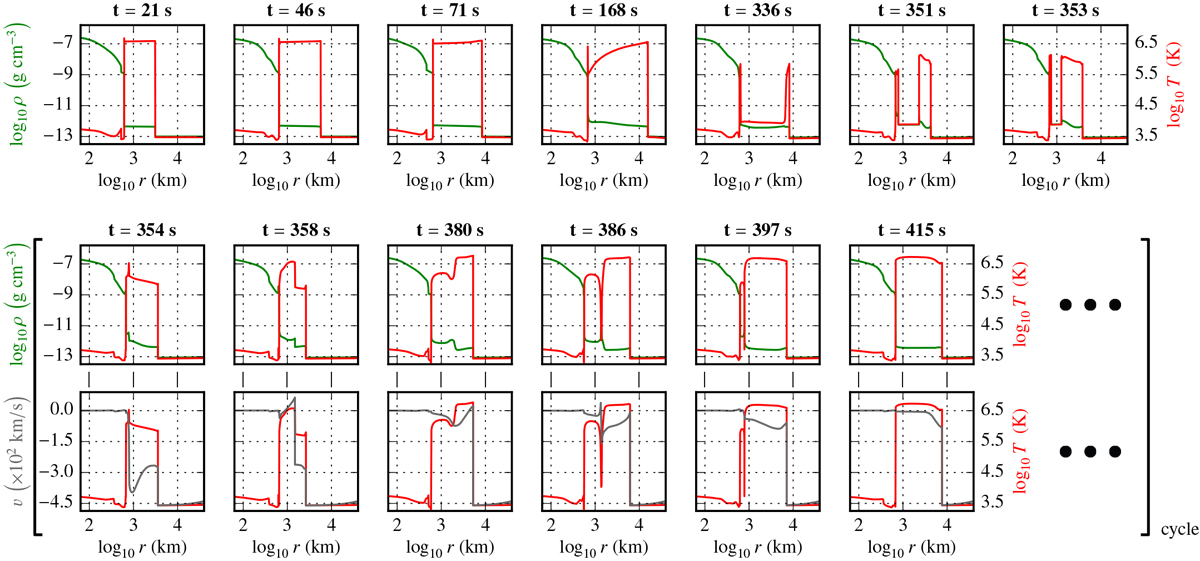
Snapshots of the density (green), temperature (red), and gas velocity (grey) profiles of the first QPO cycle with the Chr–Λ setup; the accreted gas falls from the right to the left. The first line (between 1 and 353 s) corresponds to the first cycle. The second and third lines correspond to the beginning of the second cycle. Snapshots att = 71 s and 415 s arevery close: from this time, the cycle behaves like the previous one. A typical sequence is: growth of a hot slab of shocked material (t = 21 s), quasi-isochoric cooling at the slab basis (thermal instability, t = 168 s), start of the collapse of the post-shock structure (t = 336 s), impact of the collapsing material on the chromosphere (t = 354 s), launch of a new shock before the end of the collapse (t = 358 s), passing of the two shocks (t = 380 s), end of the collapse of the old structure (t = 386 s) and growth of the new slab (t = 415 s).
Current usage metrics show cumulative count of Article Views (full-text article views including HTML views, PDF and ePub downloads, according to the available data) and Abstracts Views on Vision4Press platform.
Data correspond to usage on the plateform after 2015. The current usage metrics is available 48-96 hours after online publication and is updated daily on week days.
Initial download of the metrics may take a while.