Open Access
Fig. 2
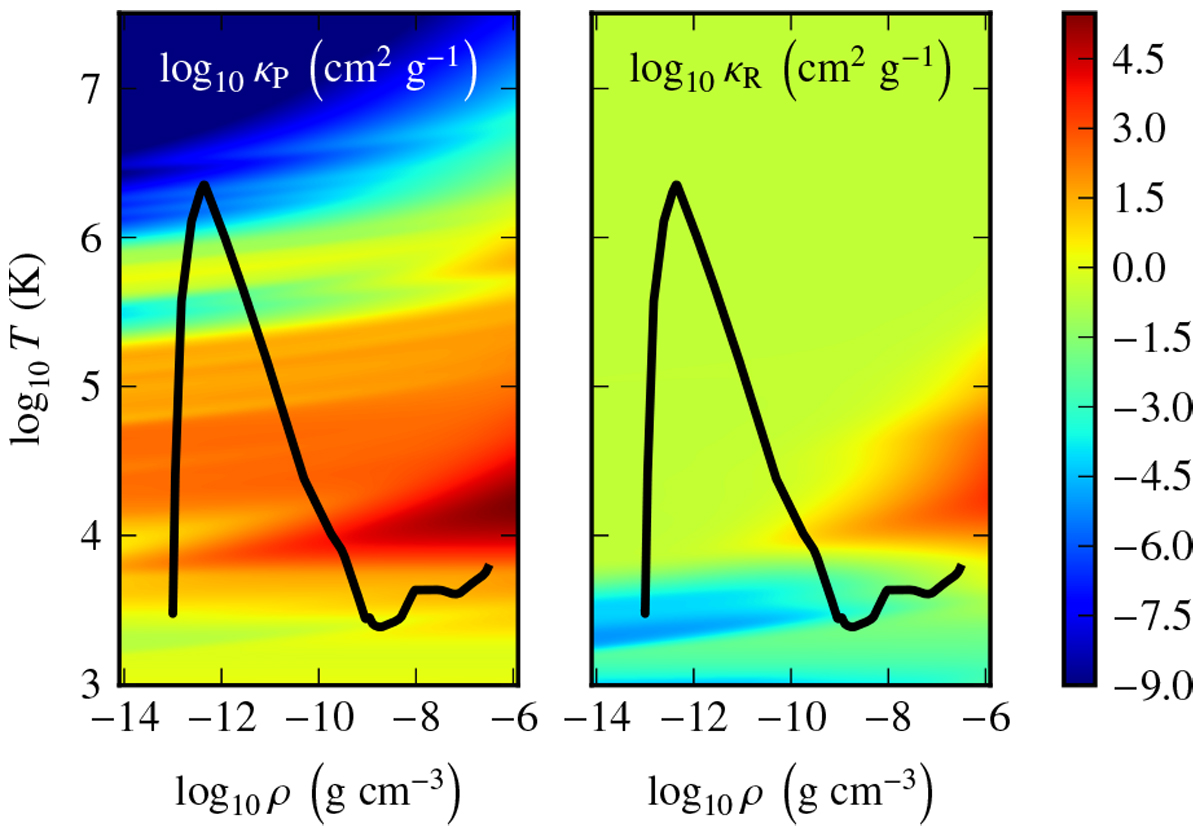
Planck (κP, left) and Rosseland (κR, right) opacities with respect to gas density and temperature, in log scale (see Appendix A). The black curve represents typical conditions in the chromosphere, accretion shock, and flow.
Current usage metrics show cumulative count of Article Views (full-text article views including HTML views, PDF and ePub downloads, according to the available data) and Abstracts Views on Vision4Press platform.
Data correspond to usage on the plateform after 2015. The current usage metrics is available 48-96 hours after online publication and is updated daily on week days.
Initial download of the metrics may take a while.