Fig. 6.
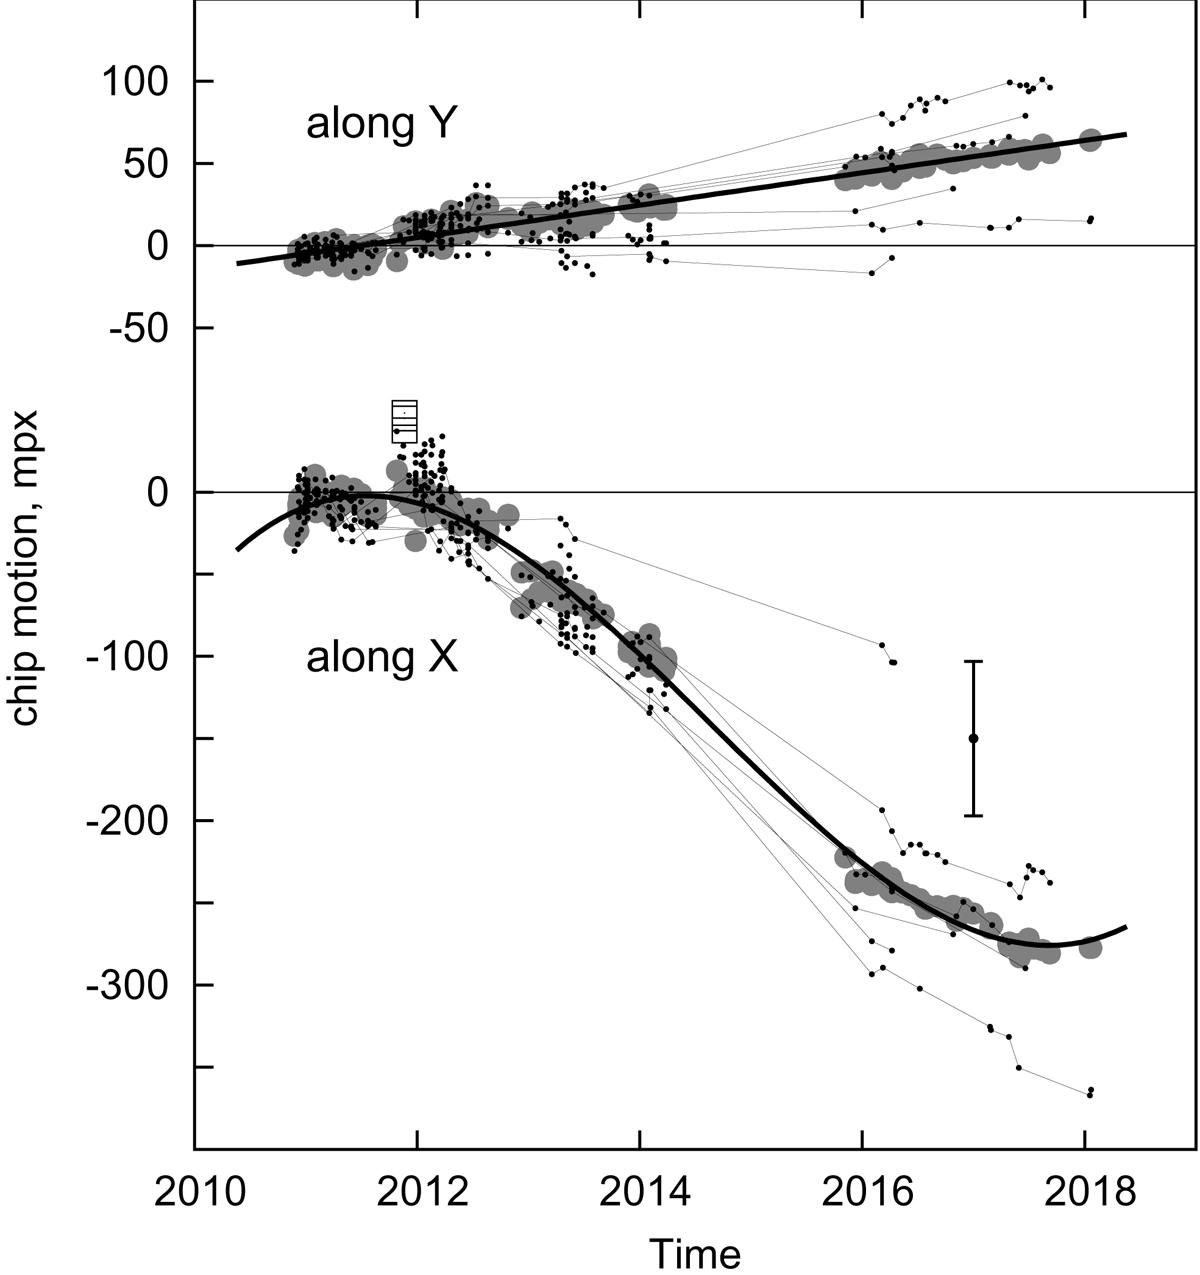
Motion of chip 2 along the X-axis (lower panel) relative to a reference frame defined by stars in both chips: the unreduced displacements ![]() for each epoch e and each sky field z are shown by dots with the typical uncertainty in 2017 (error bar). Solid lines connect the long-duration datasets. The model function H(t) for the motion of chip 2 (thick solid line) and the instant chip motion
for each epoch e and each sky field z are shown by dots with the typical uncertainty in 2017 (error bar). Solid lines connect the long-duration datasets. The model function H(t) for the motion of chip 2 (thick solid line) and the instant chip motion ![]() derived with Eq. (8) (gray circles) are shown as well. The large offset in four fields during 20–24 November 2011 is marked by squares. Upper panel: same for the measurements along the Y-axis.
derived with Eq. (8) (gray circles) are shown as well. The large offset in four fields during 20–24 November 2011 is marked by squares. Upper panel: same for the measurements along the Y-axis.
Current usage metrics show cumulative count of Article Views (full-text article views including HTML views, PDF and ePub downloads, according to the available data) and Abstracts Views on Vision4Press platform.
Data correspond to usage on the plateform after 2015. The current usage metrics is available 48-96 hours after online publication and is updated daily on week days.
Initial download of the metrics may take a while.