Fig. 5.
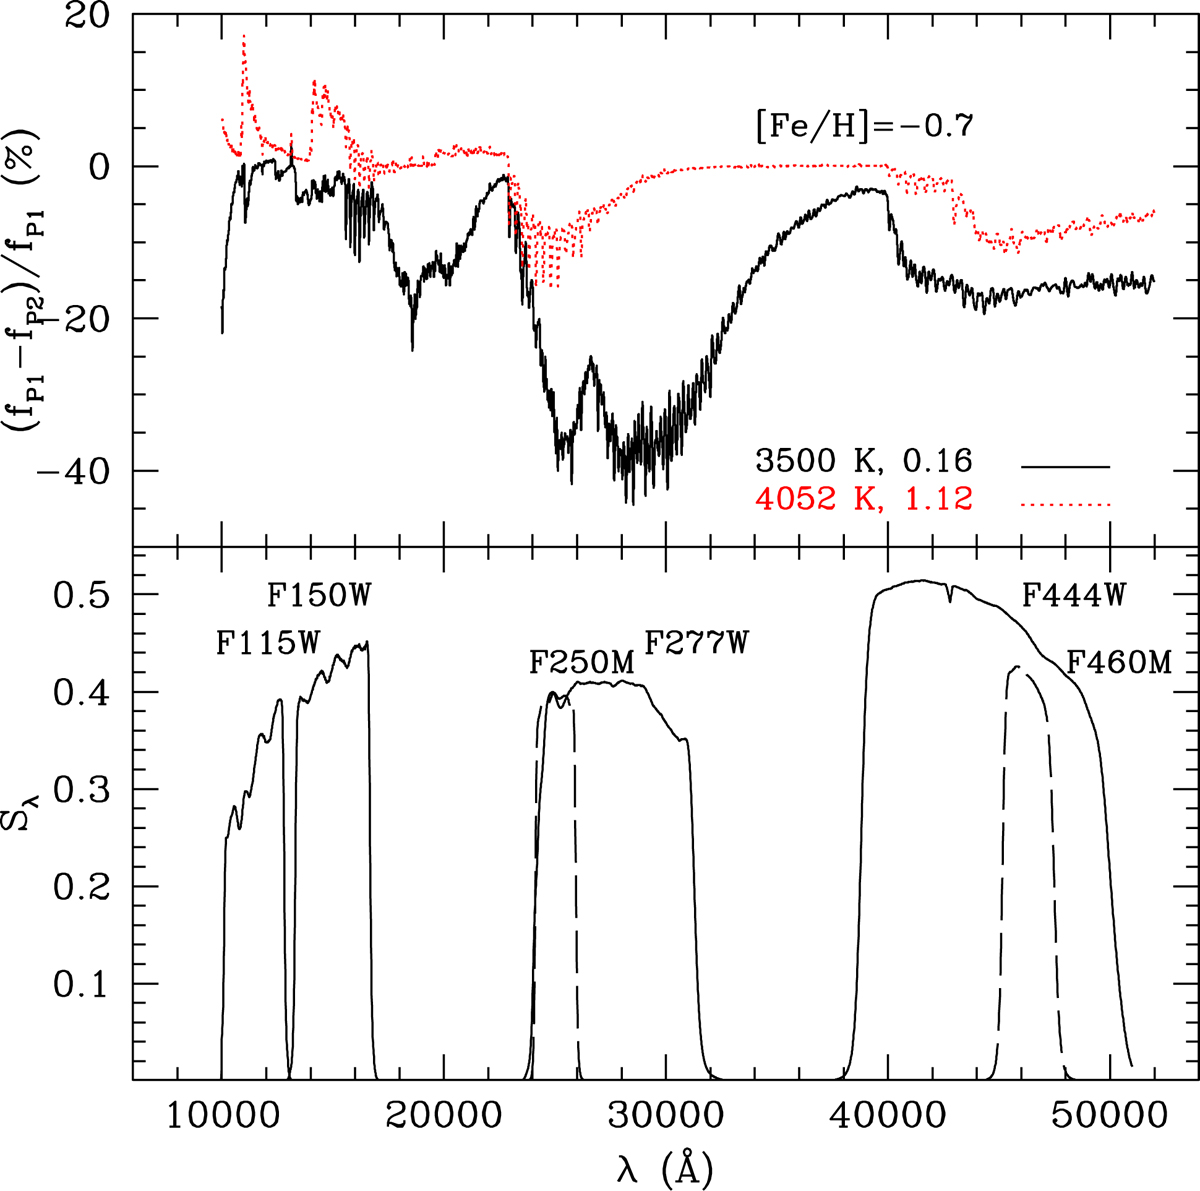
Upper panel: percentage flux difference between the SED of P1 (fP1) and P2 (fP2) models with the labelled values of Teff and log g, as a function of the wavelength λ (in Å), in the range covered by the NIRcam filters discussed here. Lower panel: total throughput of the wide and medium-band filters that cover the wavelength range showing the largest differences in the SED.
Current usage metrics show cumulative count of Article Views (full-text article views including HTML views, PDF and ePub downloads, according to the available data) and Abstracts Views on Vision4Press platform.
Data correspond to usage on the plateform after 2015. The current usage metrics is available 48-96 hours after online publication and is updated daily on week days.
Initial download of the metrics may take a while.