Fig. 3.
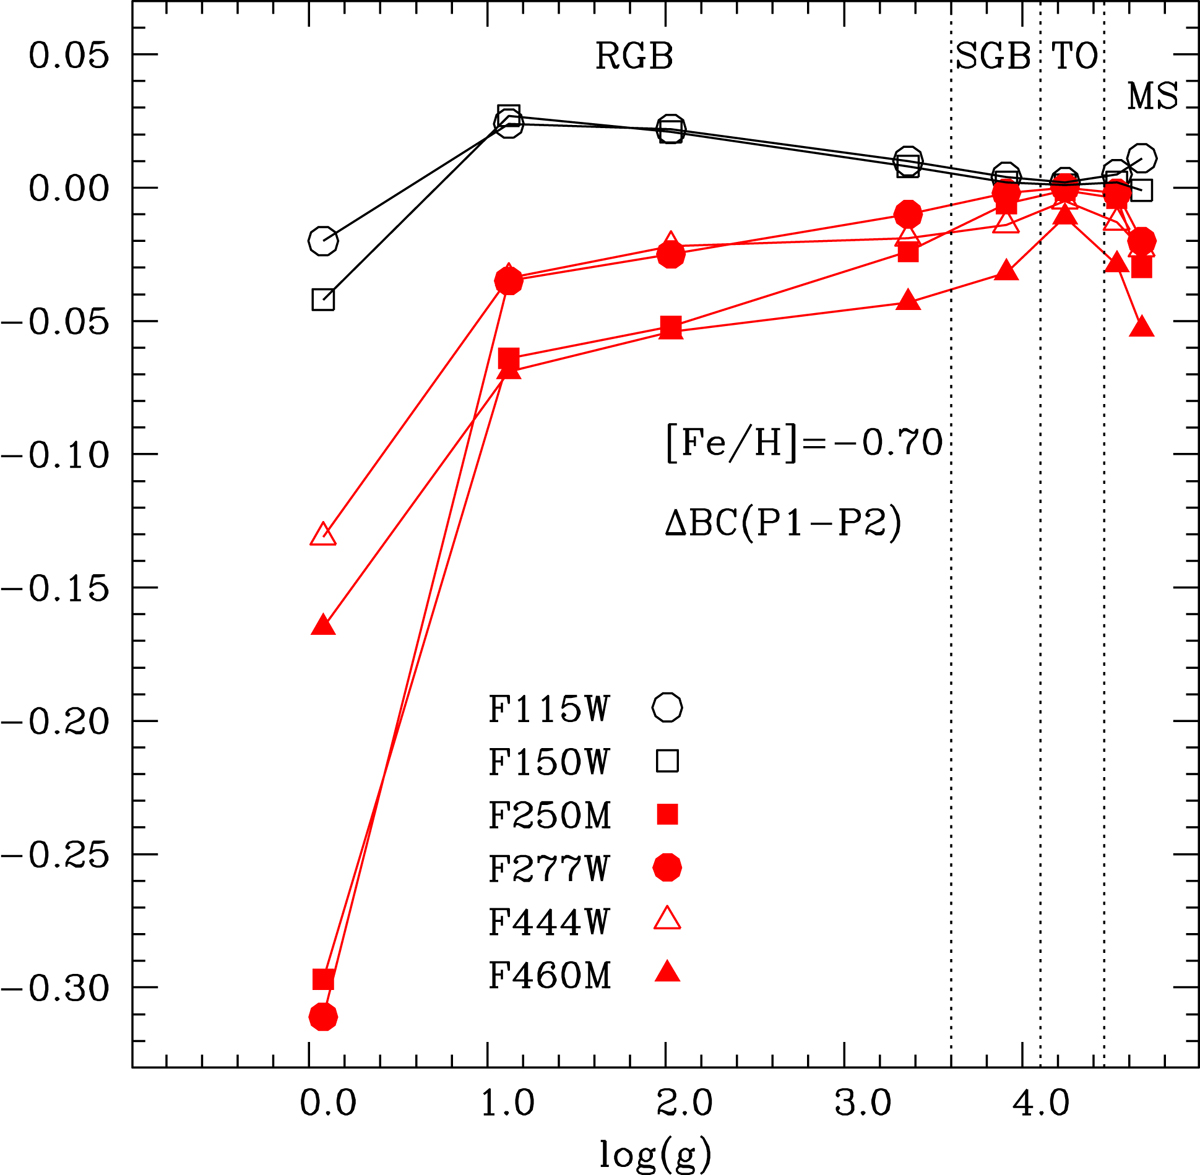
Difference (Δ(BC)) between BCs calculated for P1 and P2 compositions (P1-P2), at selected points along a 12 Gyr isochrone with [Fe/H] = −0.7 and Y = 0.256 (see Table 2). Δ(BC) is plotted as a function of the surface gravity, that decreases steadily from the lower main sequence to the tip of the RGB. We also label the evolutionary phases corresponding to the selected isochrone points: main sequence (MS), turn off (TO), subgiant branch (SGB), and RGB. Only filters showing the largest positive and negative differences are displayed (see text for details).
Current usage metrics show cumulative count of Article Views (full-text article views including HTML views, PDF and ePub downloads, according to the available data) and Abstracts Views on Vision4Press platform.
Data correspond to usage on the plateform after 2015. The current usage metrics is available 48-96 hours after online publication and is updated daily on week days.
Initial download of the metrics may take a while.