Fig. 3.
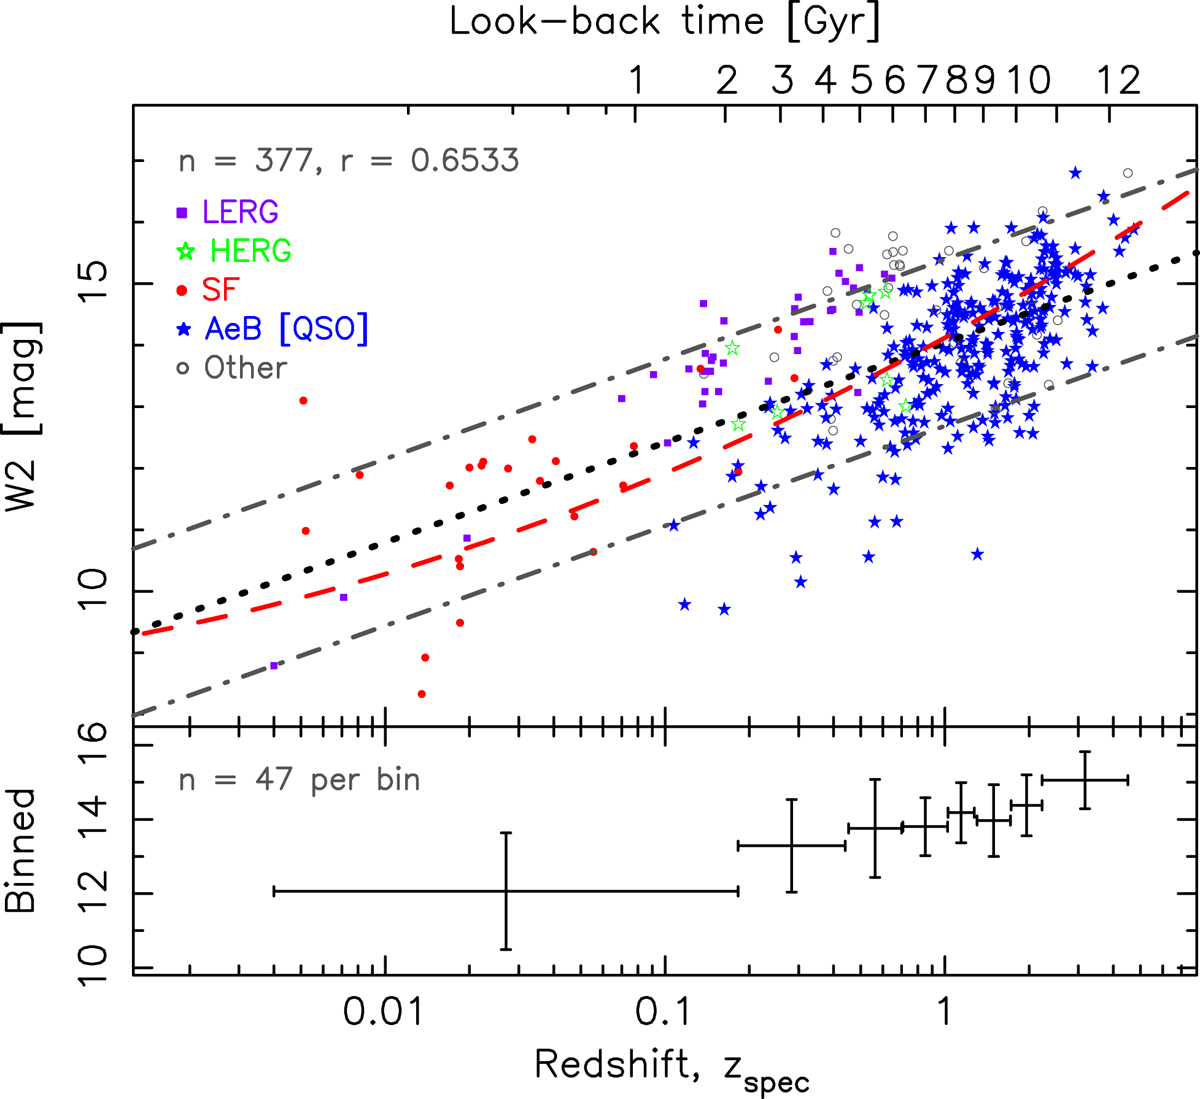
Hubble W2-band diagram for the LARGESS sample. The dotted line shows the least-squares fit, with regression coefficient r, and the dot–dashed lines showing the ±1σ span of this. The filled squares signify high-excitation radio galaxies (HERGs), the unfilled stars low-excitation radio galaxies (LERGs), the circles star-forming (SF) galaxies and the filled stars broad emission line (AeB) sources (suspected quasars, Ching et al. 2017). The broken curve shows the fit of Glowacki et al. (2019) to the QSOs (their Table 2). The bottom panel shows the mean values in equally sized bins with the vertical error bars showing ±1σ and the horizontal bars the range.
Current usage metrics show cumulative count of Article Views (full-text article views including HTML views, PDF and ePub downloads, according to the available data) and Abstracts Views on Vision4Press platform.
Data correspond to usage on the plateform after 2015. The current usage metrics is available 48-96 hours after online publication and is updated daily on week days.
Initial download of the metrics may take a while.