Free Access
Fig. 18.
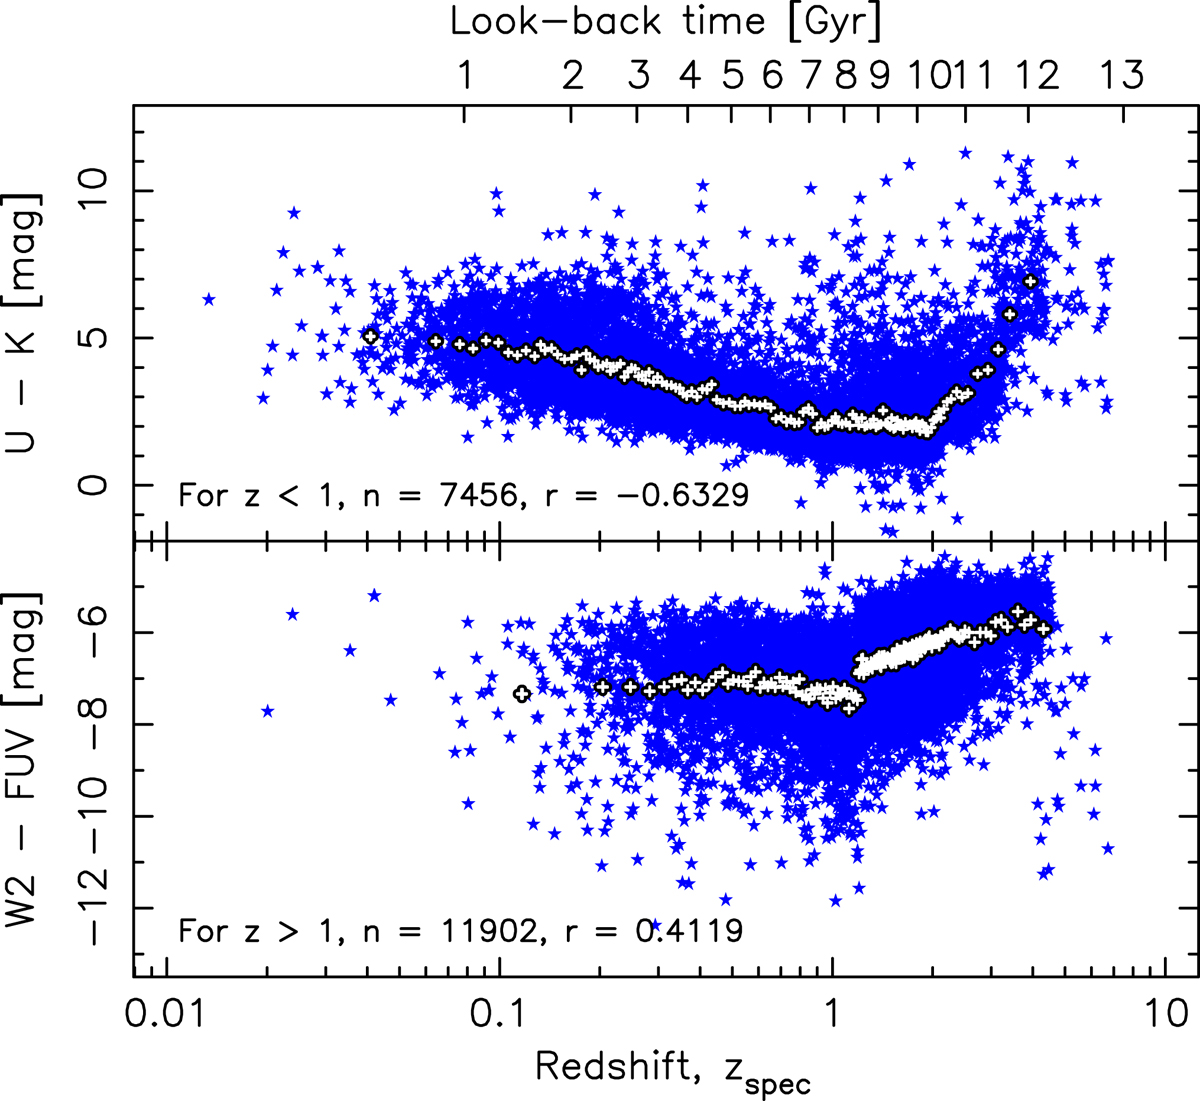
Observed U − K and W2 − FUV colours versus redshift for the SDSS sample. The overlain error bars show the mean values in equally sized bins (of 100), spanning the error range (±1σ/10). In the bottom paneln = 4322 and r = −0.0366 for zspec < 1.
Current usage metrics show cumulative count of Article Views (full-text article views including HTML views, PDF and ePub downloads, according to the available data) and Abstracts Views on Vision4Press platform.
Data correspond to usage on the plateform after 2015. The current usage metrics is available 48-96 hours after online publication and is updated daily on week days.
Initial download of the metrics may take a while.