Fig. 4.
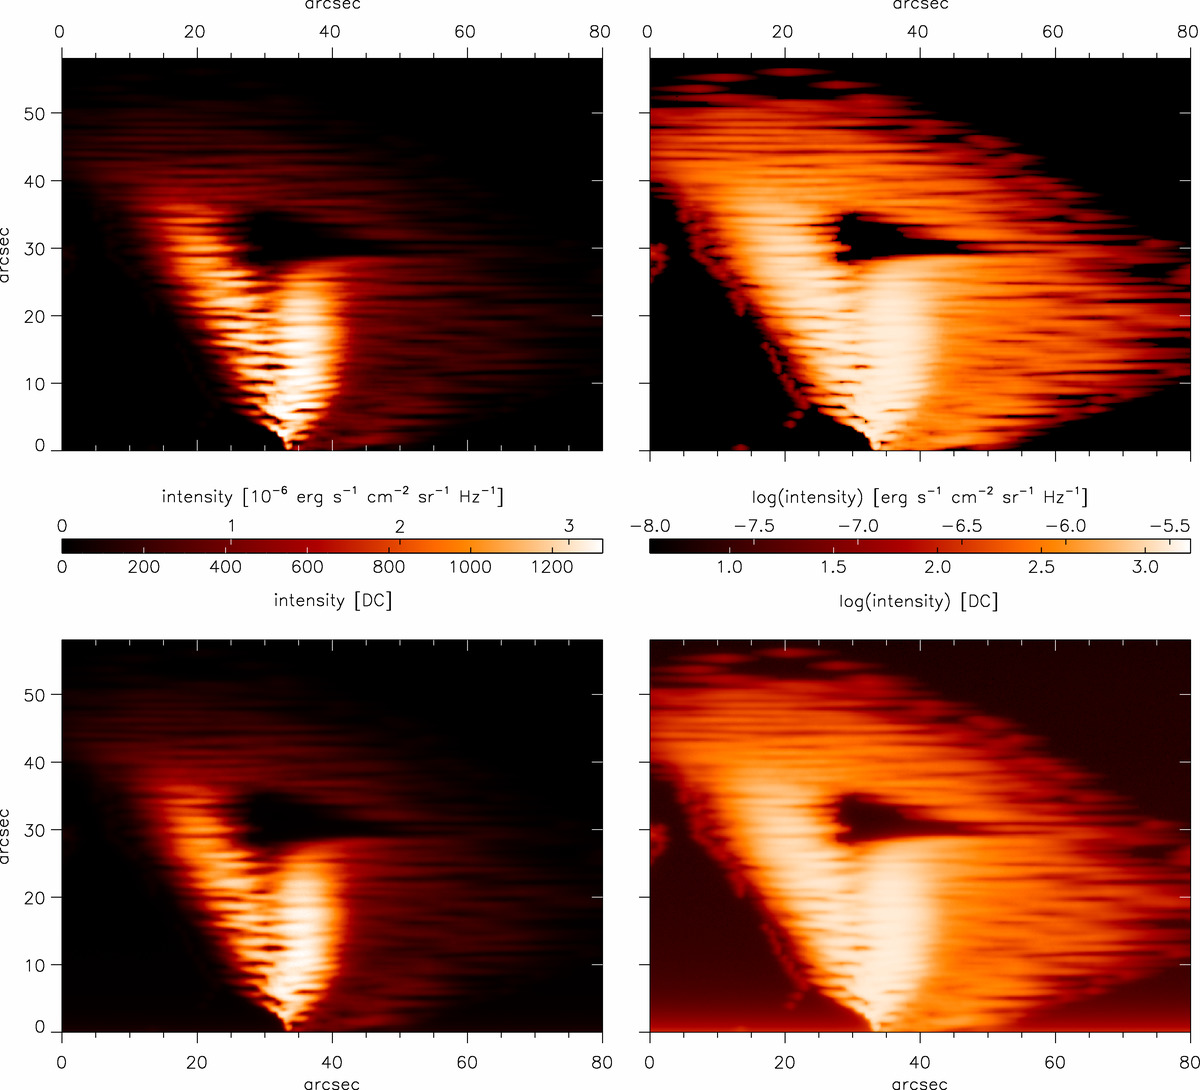
Comparison between the Hα line-center visualization technique used in the current 3D WPFS models and the SOT-like Hα visualization that includes the Hinode/SOT NFI instrumental effects. In all panels, we show a detailed view of the GDASH model. In the top row, we display the synthetic images in Hα line-center and in the bottom row the synthetic SOT-like Hα images. In the left column, we plot intensities in the linear scale and in the right column in the logarithmic scale. All intensities are plotted in an identical color scale in units of erg s−1 cm−2 sr−1 Hz−1 (top row) and digital counts (DC, bottom row). Dimensions are expressed in arcsec.
Current usage metrics show cumulative count of Article Views (full-text article views including HTML views, PDF and ePub downloads, according to the available data) and Abstracts Views on Vision4Press platform.
Data correspond to usage on the plateform after 2015. The current usage metrics is available 48-96 hours after online publication and is updated daily on week days.
Initial download of the metrics may take a while.