Fig. 3.
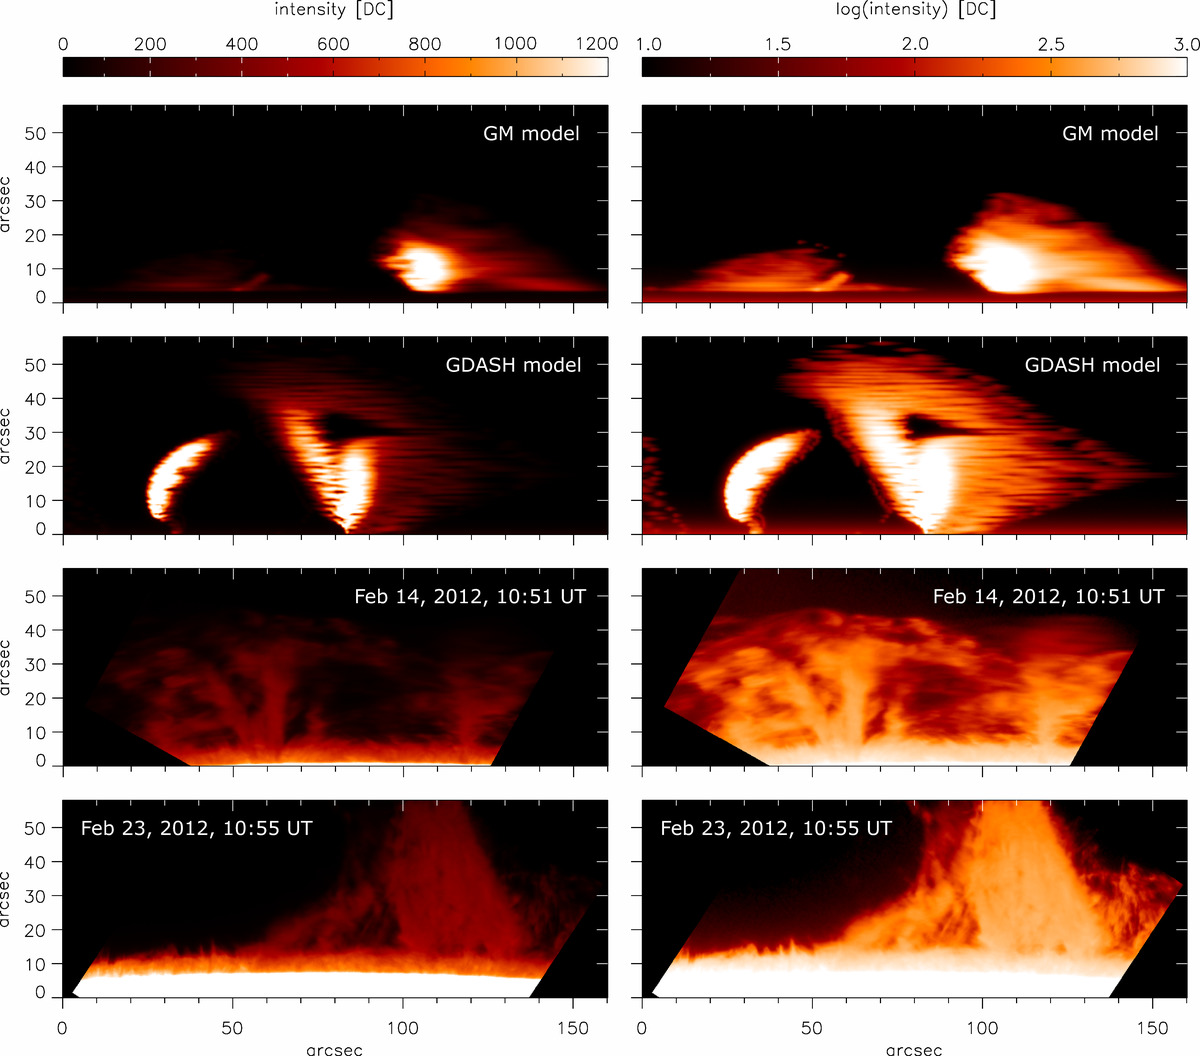
Comparison between the synthetic SOT-like images provided by the 3D WPFS model of Gunár & Mackay (2015a, the GM model, top row), the 3D WPFS model of Gunár et al. (2018a, the GDASH model, second row,) and selected quiescent prominences observed by Hinode/SOT NFI on Feb 14 and Feb 23, 2012. In the left column, we plot the intensities in the linear scale and in the right column we plot the same intensities in the logarithmic scale. Intensities in each column are expressed in units of digital counts (DC) and plotted in an identical color scale. The field of view in all panels is identical and dimensions are expressed in arcsec.
Current usage metrics show cumulative count of Article Views (full-text article views including HTML views, PDF and ePub downloads, according to the available data) and Abstracts Views on Vision4Press platform.
Data correspond to usage on the plateform after 2015. The current usage metrics is available 48-96 hours after online publication and is updated daily on week days.
Initial download of the metrics may take a while.