Free Access
Fig. 2.
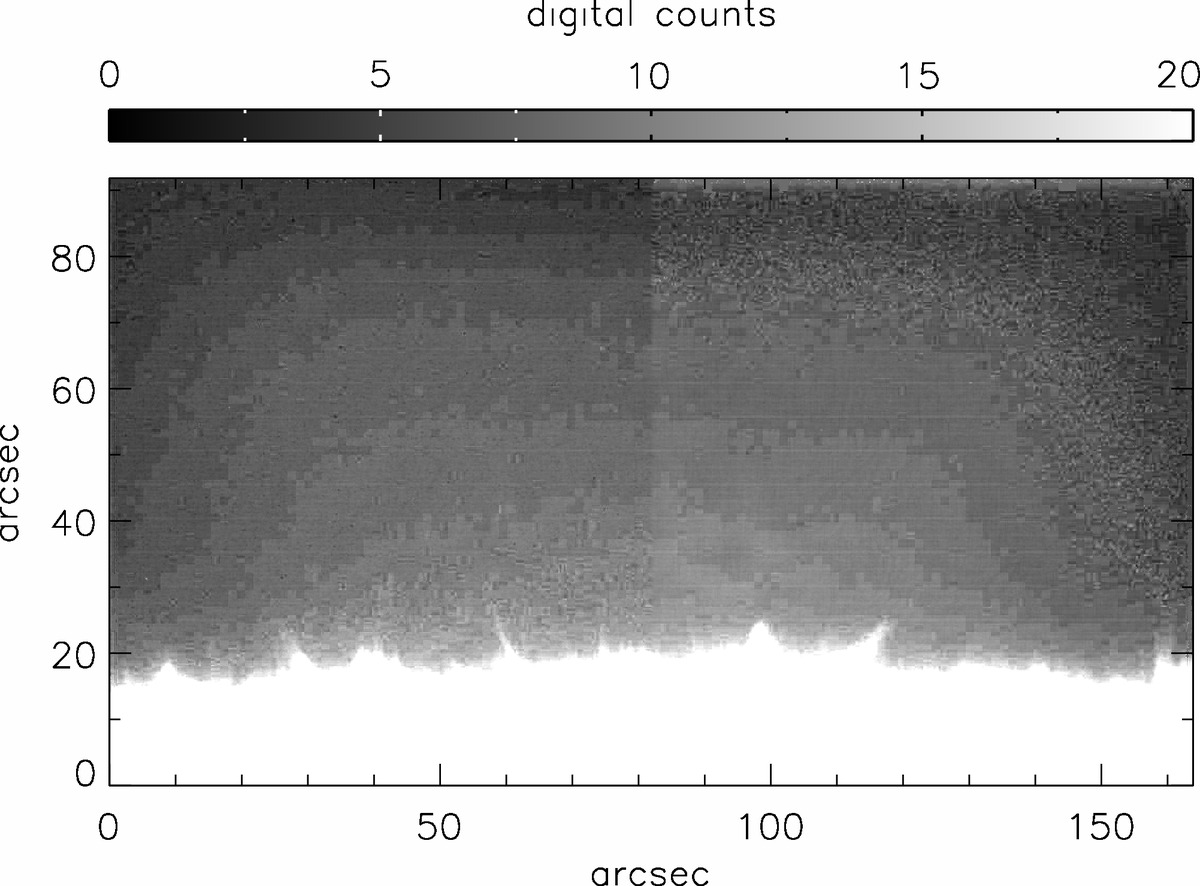
Highly saturated image of the Hinode/SOT NFI observations of the solar north pole obtained on May 3, 2010, at 15:00 UT in the Hα line core. This image shows very weak signals extending more than 60″ above the limb. These signals were used to estimate the stray light and noise levels of the Hinode/SOT NFI.
Current usage metrics show cumulative count of Article Views (full-text article views including HTML views, PDF and ePub downloads, according to the available data) and Abstracts Views on Vision4Press platform.
Data correspond to usage on the plateform after 2015. The current usage metrics is available 48-96 hours after online publication and is updated daily on week days.
Initial download of the metrics may take a while.