Fig. 22
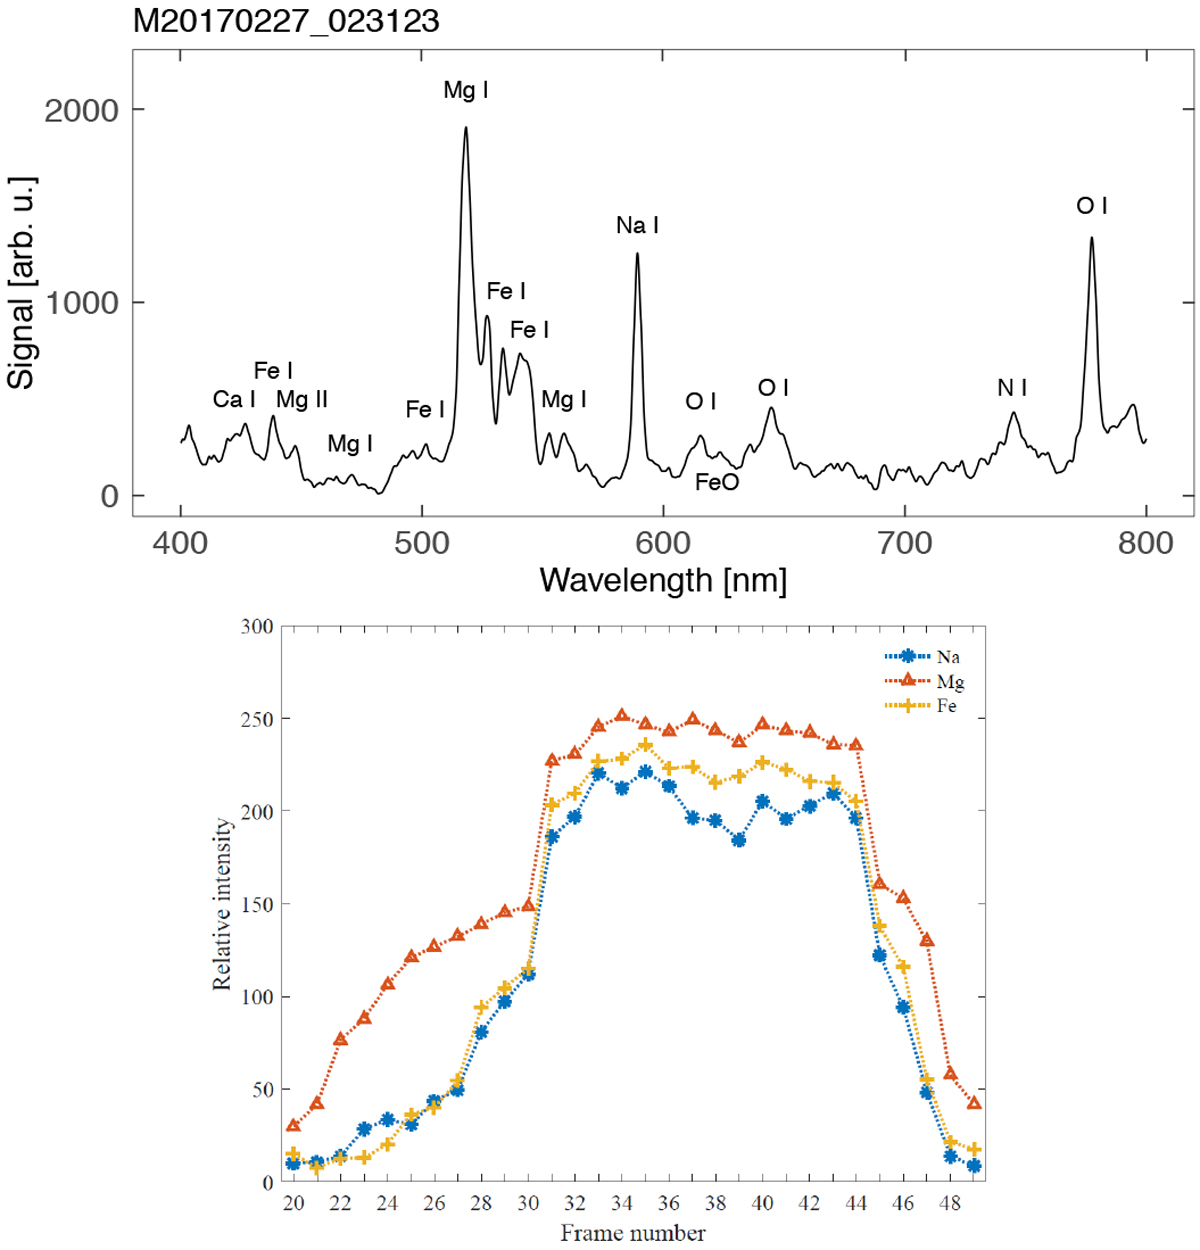
Spectrum of a bright Na-poor meteor M20170227_023123 with identified major lines (upper). The monochromatic light curve (lower) shows early emission of Mg, which also remains after Na and Fe lines disappear. Here, the Fe I monochromatic light curve is only represented by the intensity of the 526.9 nm line. One frame corresponds to a time period of 1/12 s.
Current usage metrics show cumulative count of Article Views (full-text article views including HTML views, PDF and ePub downloads, according to the available data) and Abstracts Views on Vision4Press platform.
Data correspond to usage on the plateform after 2015. The current usage metrics is available 48-96 hours after online publication and is updated daily on week days.
Initial download of the metrics may take a while.