Fig. 16
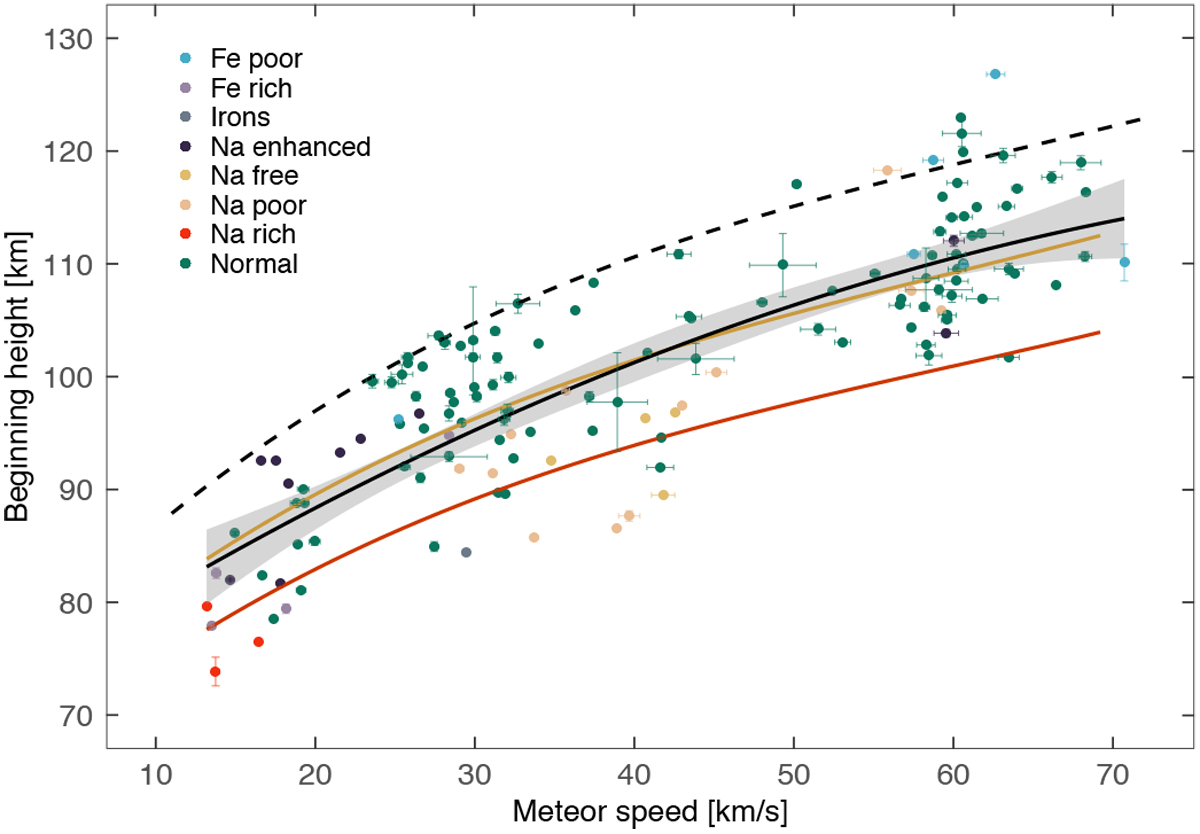
Meteor beginning height as a function of entry speed for different spectral types of meteors. The solid line represents a quadratic fit to the running average of our data and standard error of the mean. The dashed line represents the fit of the data for fainter meteors from Vojáček et al. (2019). Orange and red lines show a theoretical model for cometary and asteroidal meteors, respectively, simulated for systems of comparable sensitivity (CAMS-type) by Vida et al. (2018).
Current usage metrics show cumulative count of Article Views (full-text article views including HTML views, PDF and ePub downloads, according to the available data) and Abstracts Views on Vision4Press platform.
Data correspond to usage on the plateform after 2015. The current usage metrics is available 48-96 hours after online publication and is updated daily on week days.
Initial download of the metrics may take a while.