Fig. 6.
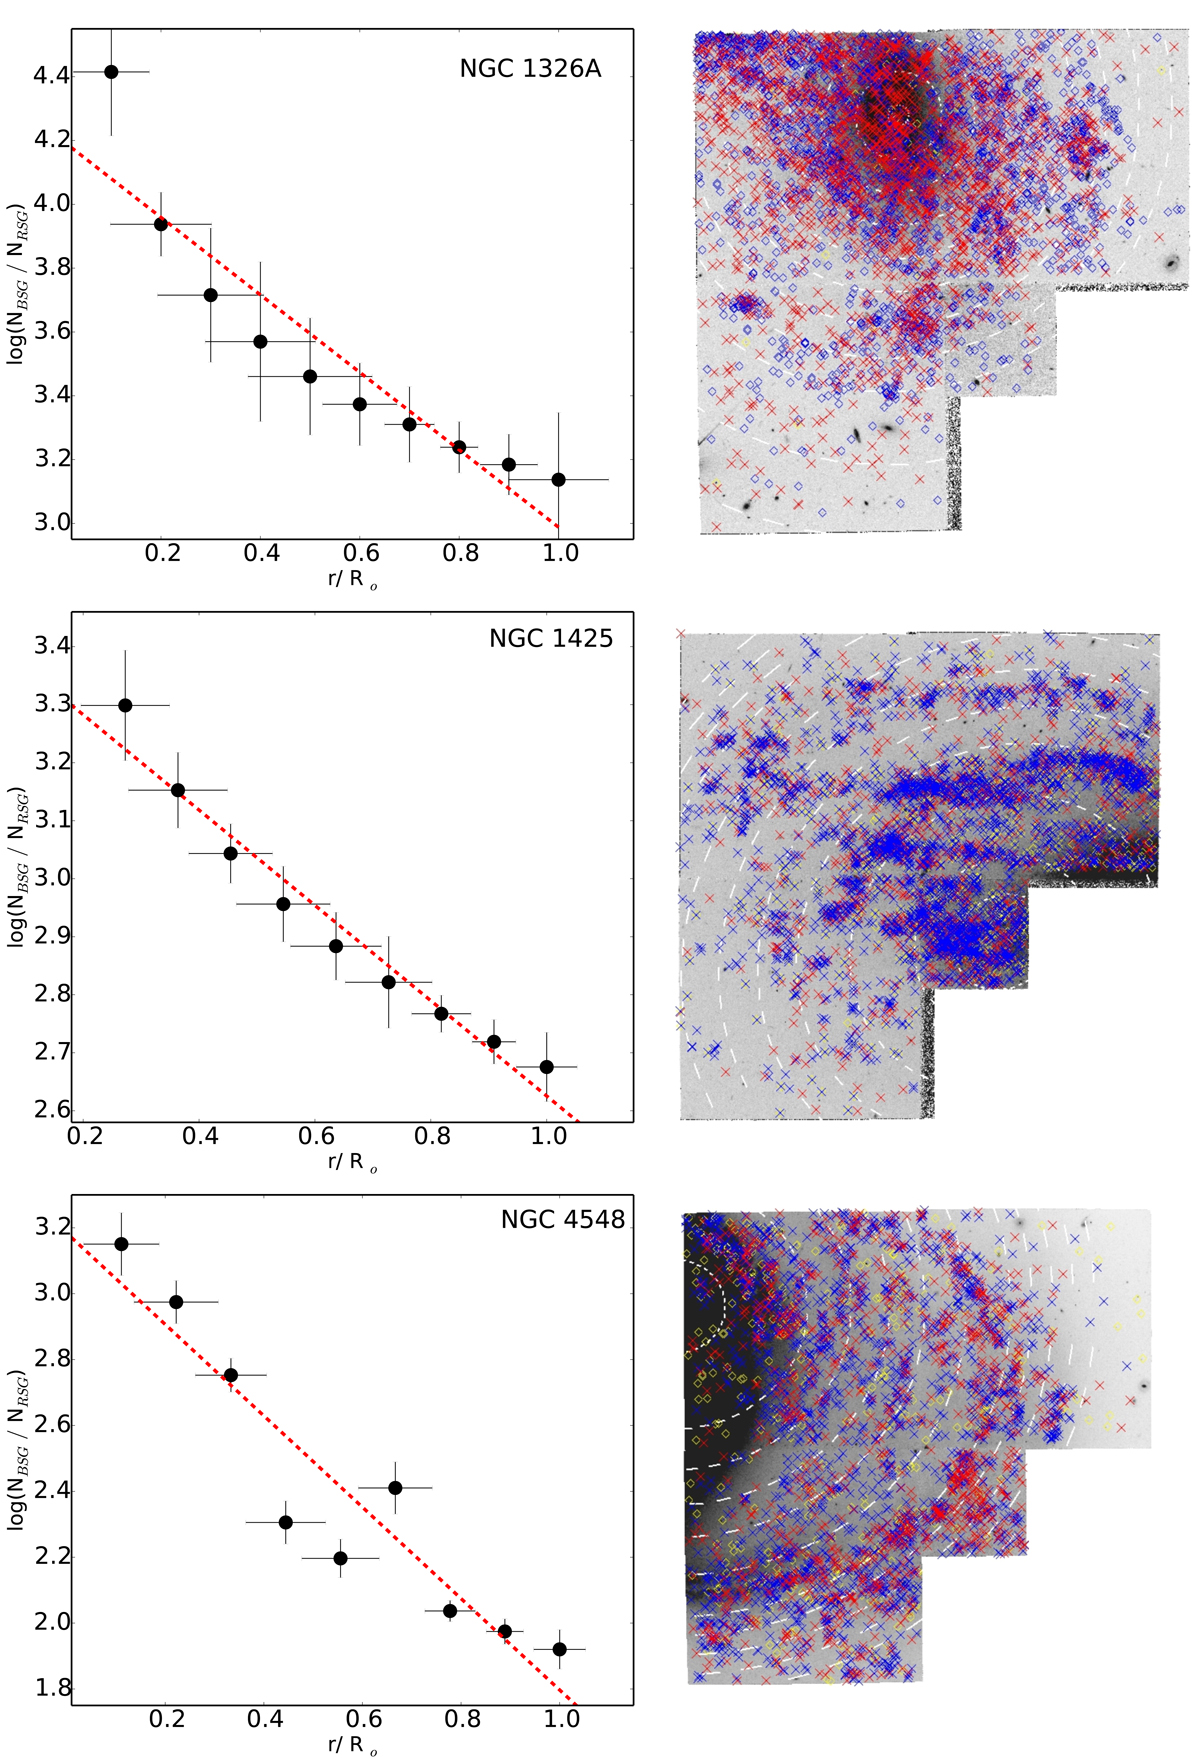
Left column: blue to red supergiant ratio for NGC 1326A, NGC 1425, and, NGC 4548. The dashed red line is a linear fit indicating the monotonic radial decline of the blue to red supergiants. Right column: spatial distribution of the blue and red supergiants. The radius of each of the white annuli displayed shows the distance with respect to the center of each galaxy.
Current usage metrics show cumulative count of Article Views (full-text article views including HTML views, PDF and ePub downloads, according to the available data) and Abstracts Views on Vision4Press platform.
Data correspond to usage on the plateform after 2015. The current usage metrics is available 48-96 hours after online publication and is updated daily on week days.
Initial download of the metrics may take a while.