Fig. 8.
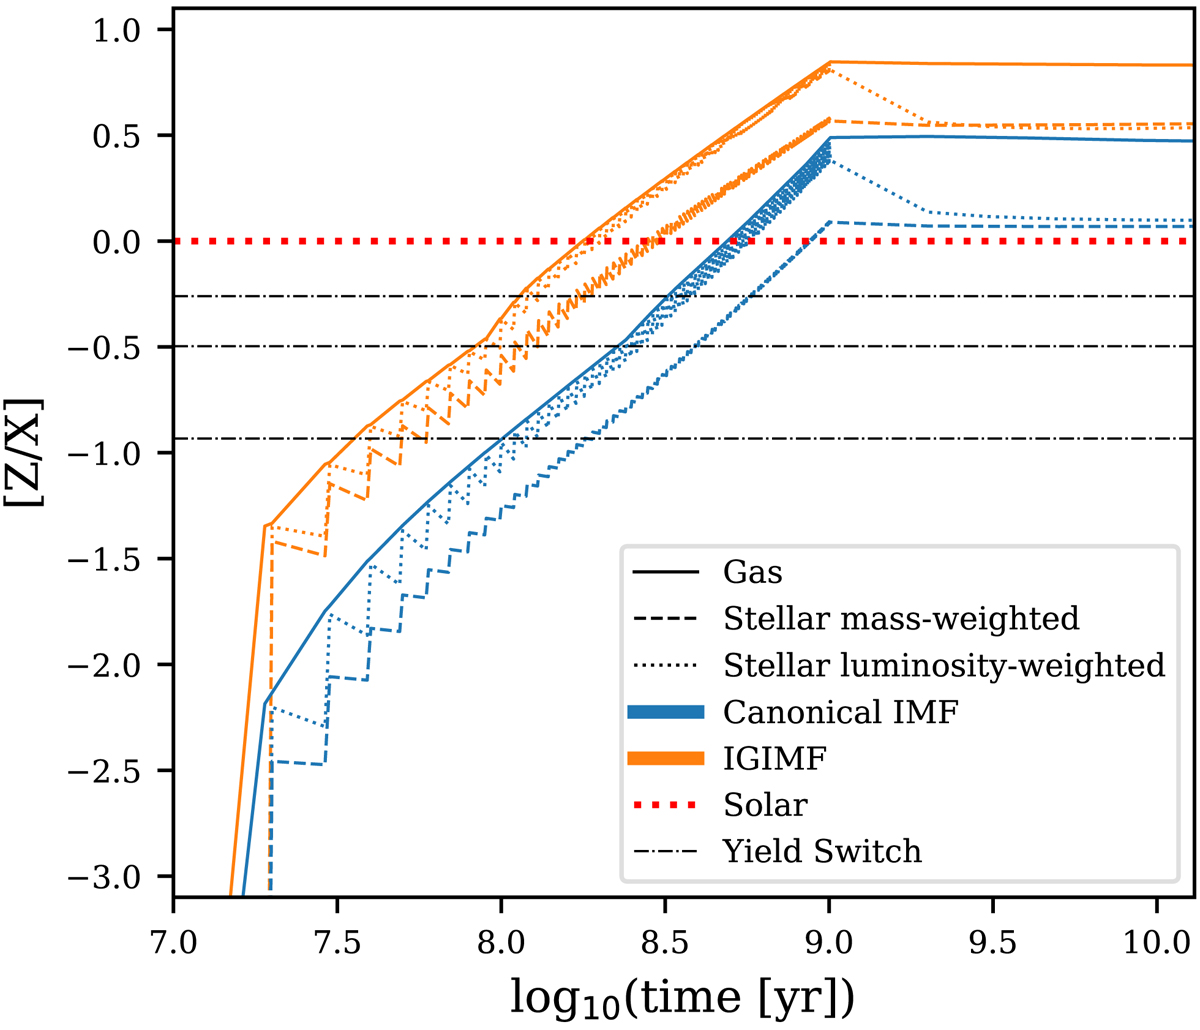
Evolution of gas- and mass-averaged stellar [Z/X] for the boxy SFH shown in Fig. 2, where [Z/X] is defined in Sect. 5.6. Simulations applying the IGIMF theory and fixed canonical IMF are shown as the orange and blue lines, respectively. The solid, dashed, and dotted lines represent the value calculated for gas phase, mass average, and luminosity average (approximation, see text), respectively. The horizontal dash-dotted lines mark the boundaries where the stellar yield table is changed (at [Z/X] ≈ [Z] = −0.26, −0.497, −0.933, see Sect. 4.4 for explanation), which causes a change in the speed of enrichment (but with a 10 Myr delay). The serrated shape is caused by our simplification that all the stars formed in a 10 Myr star formation epoch have an identical age.
Current usage metrics show cumulative count of Article Views (full-text article views including HTML views, PDF and ePub downloads, according to the available data) and Abstracts Views on Vision4Press platform.
Data correspond to usage on the plateform after 2015. The current usage metrics is available 48-96 hours after online publication and is updated daily on week days.
Initial download of the metrics may take a while.