Fig. 7.
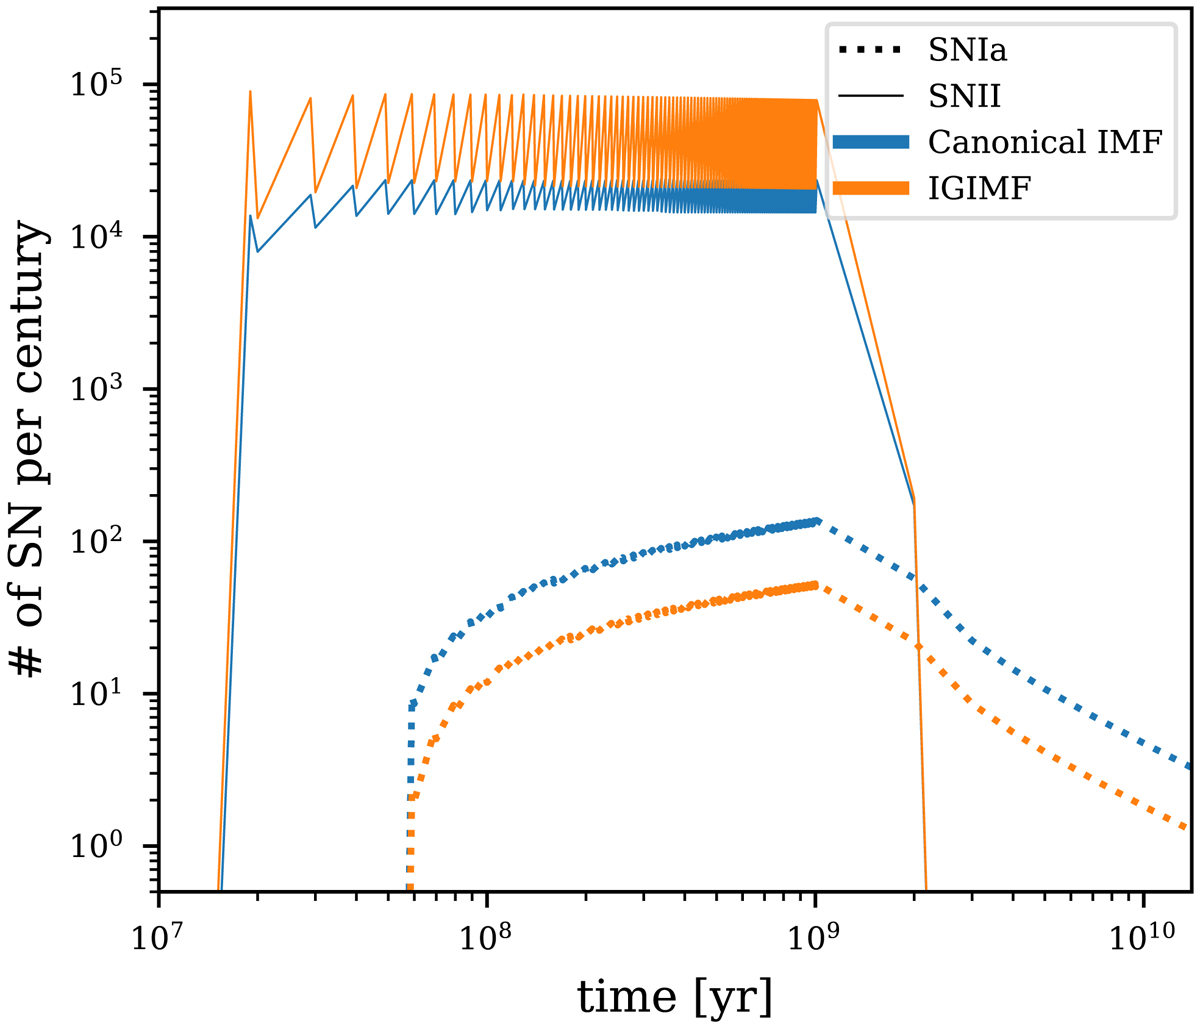
Number of SNIa and SNII per century as a function of time for the boxy SFH shown in Fig. 2. As in Fig. 6, the orange lines are the results applying the IGIMF theory, while the blue lines apply the invariant canonical IMF. The thick lines below and the thin lines above are the rates for SNIa and SNII, respectively. The serrated shape is caused by the simplification that all the stars formed in a 10 Myr star formation epoch have an identical age.
Current usage metrics show cumulative count of Article Views (full-text article views including HTML views, PDF and ePub downloads, according to the available data) and Abstracts Views on Vision4Press platform.
Data correspond to usage on the plateform after 2015. The current usage metrics is available 48-96 hours after online publication and is updated daily on week days.
Initial download of the metrics may take a while.