Fig. 5.
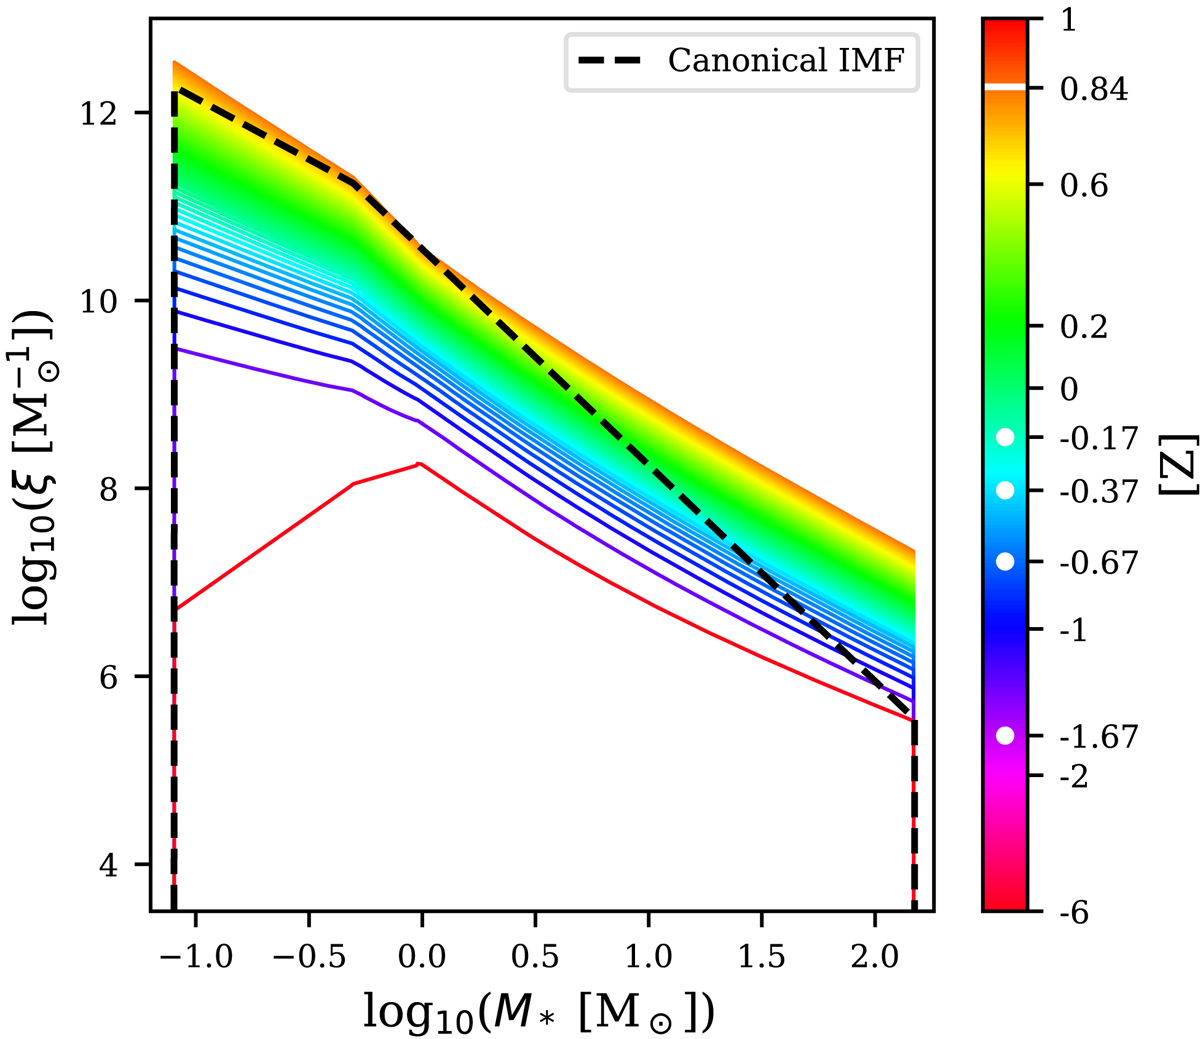
Evolution of the TIgwIMF for a galaxy with the boxy SFH shown in Fig. 2, where ξ is the total number of stars within a unit mass range. The assumed lowest and highest possible stellar mass is 0.08 M⊙ and 150 M⊙, respectively, following Yan et al. (2017). The solid lines represent the TIgwIMF after 10, 20, ..., and 1000 Myr since the beginning of the star formation (from bottom to top). The colour of the lines indicates the metallicity [Z] (as defined in Eq. (5)) in gas at the time. The colour-coding is the same as in Figs. 3 and 4; the white dots in the colour bar indicate the available initial metallicity values of the stellar yield table (see Sect. 4.4) and the white line indicates the initial metallicity of the last stellar population (i.e. the most metal-rich population). The dashed line is the canonical IMF given by Kroupa (2001), normalized to have the same ξ as the final TIgwIMF at M* = 1.
Current usage metrics show cumulative count of Article Views (full-text article views including HTML views, PDF and ePub downloads, according to the available data) and Abstracts Views on Vision4Press platform.
Data correspond to usage on the plateform after 2015. The current usage metrics is available 48-96 hours after online publication and is updated daily on week days.
Initial download of the metrics may take a while.