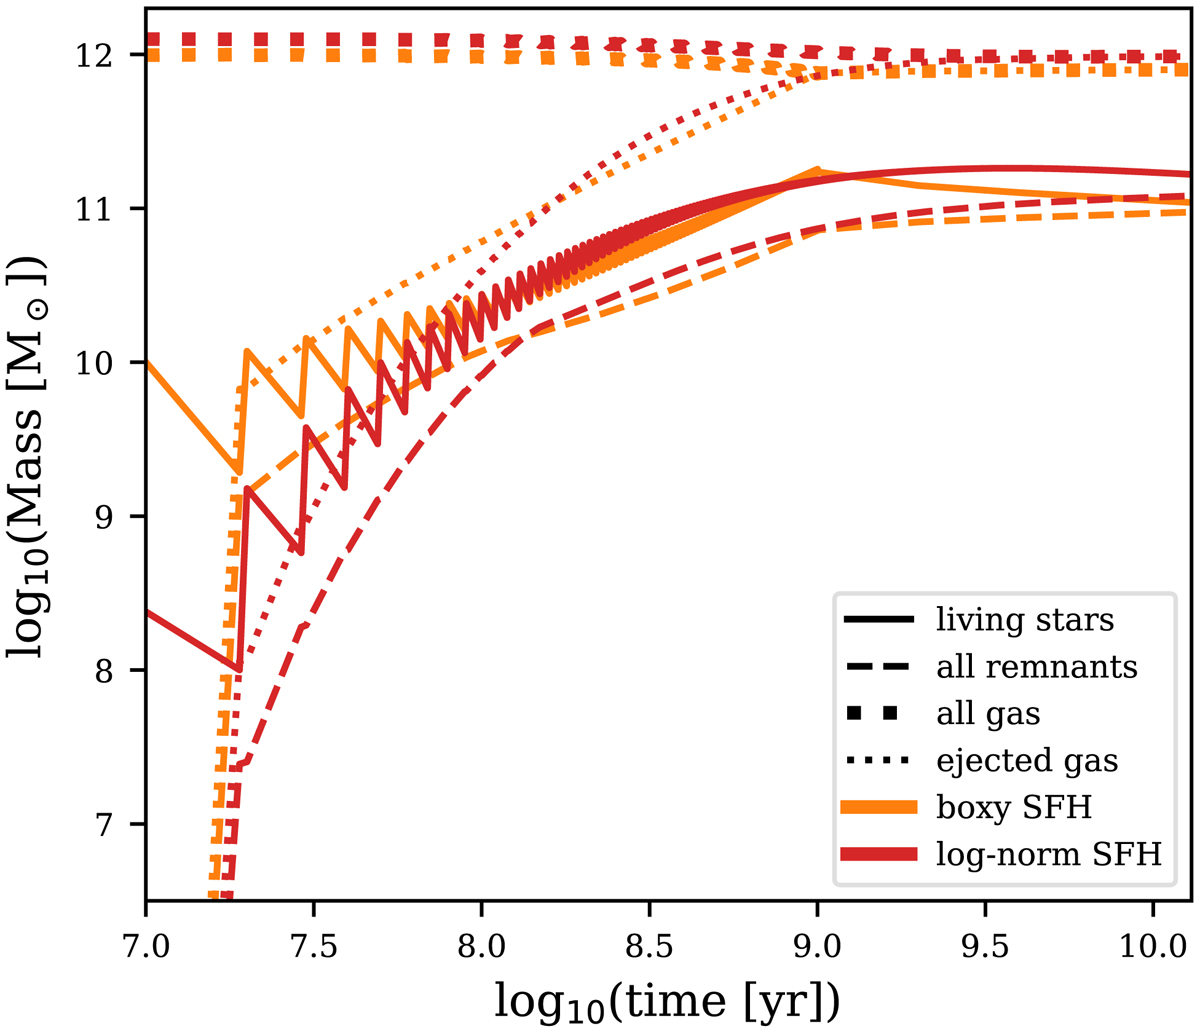
Fig. A.2.

Same as Fig. 6, but comparing different SFHs instead of different IMF assumptions. The orange lines apply the boxy SFH and the red lines apply the log-normal SFH, both shown in Fig. 2. The same colour-coding is applied from Figs. A.2–A.7. The serrated shape is caused by the dying stars with a lifetime shorter than 10 Myr (see Sect. 6.2). We note that the orange lines are the same as the orange lines in Fig. 6.
Current usage metrics show cumulative count of Article Views (full-text article views including HTML views, PDF and ePub downloads, according to the available data) and Abstracts Views on Vision4Press platform.
Data correspond to usage on the plateform after 2015. The current usage metrics is available 48-96 hours after online publication and is updated daily on week days.
Initial download of the metrics may take a while.


