Fig. 2.
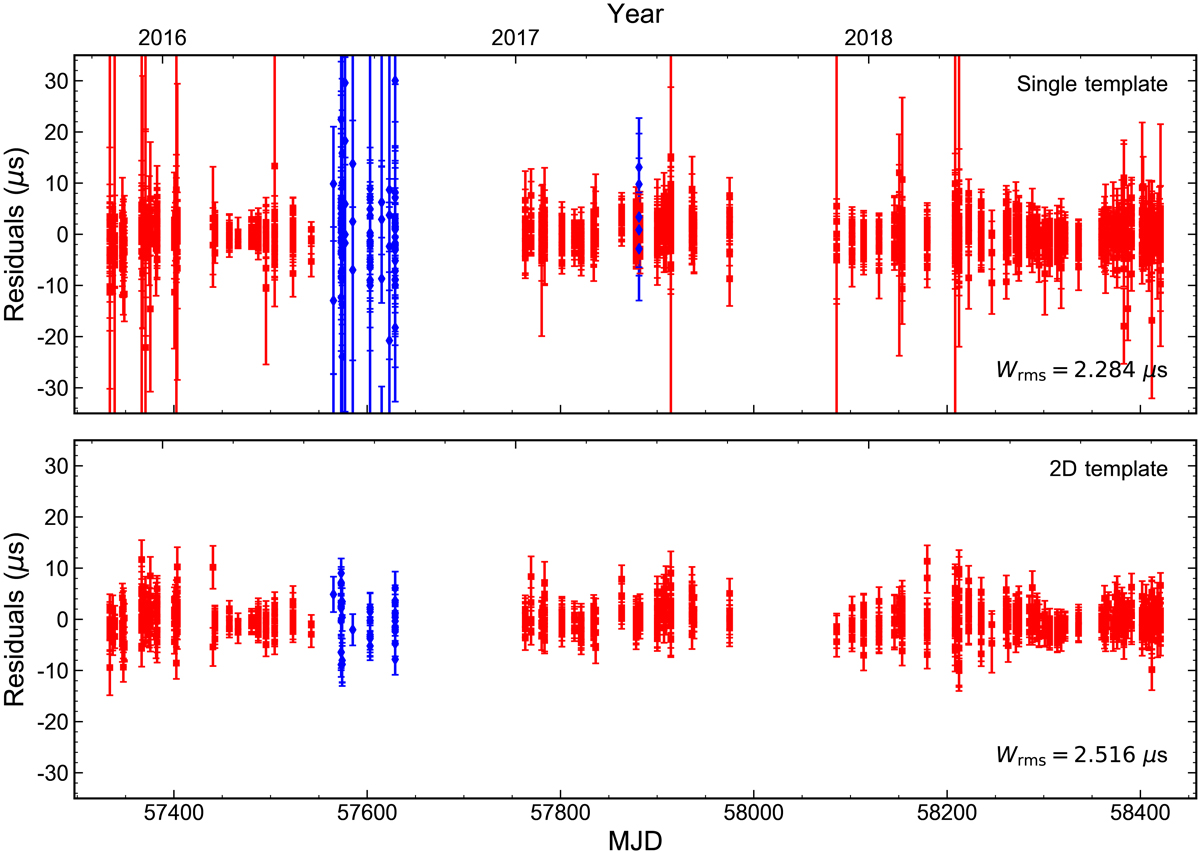
Post-fit timing residuals as a function of time for the best-fit timing solutions presented in Table 1, considering non-eclipsing binary phases only. Residuals shown in the upper panel are based on TOAs extracted by using a single template profile representative of the full 512-MHz bandwidth at 1.4 GHz, while those in the lower panel are based on TOAs obtained by fitting a template profile with the full frequency resolution to the data. Details on the TOA integration times, frequency bandwidths, and extraction procedures are given in Sect. 2 for the upper panel, and in Sect. 3 for the lower panel. Residuals shown as red squares (resp., blue diamonds) correspond to observations made at 1.4 GHz (resp., 2.1 and 2.5 GHz). In the upper panel (respectively, the lower panel), TOA uncertainties were multiplied by a correction factor (EFAC, see Sect. 2.1), of 1.074 (resp., 1.726).
Current usage metrics show cumulative count of Article Views (full-text article views including HTML views, PDF and ePub downloads, according to the available data) and Abstracts Views on Vision4Press platform.
Data correspond to usage on the plateform after 2015. The current usage metrics is available 48-96 hours after online publication and is updated daily on week days.
Initial download of the metrics may take a while.