Free Access
Fig. 1.
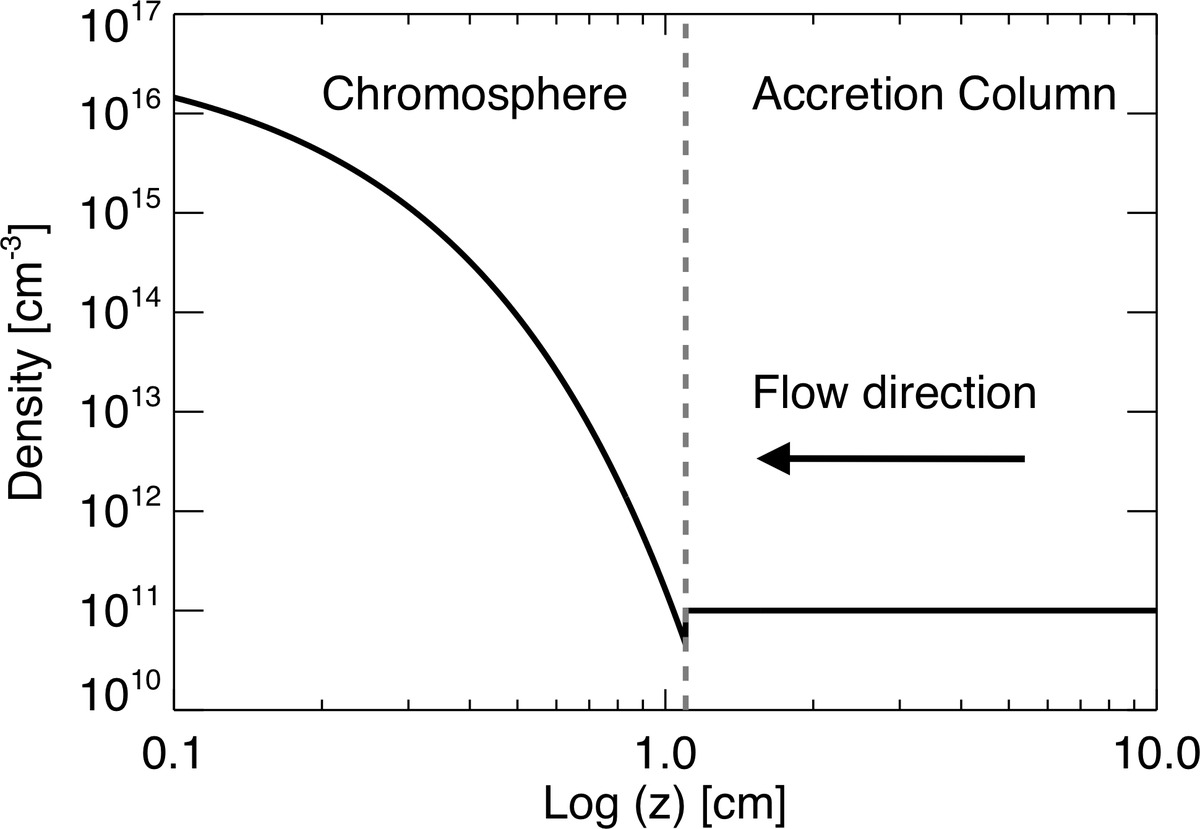
Initial profile of density along the z-axis (in Log scale). The dashed gray line separates the pre-shock chromosphere from the pre-shock accretion column. The arrow shows the flow direction.
Current usage metrics show cumulative count of Article Views (full-text article views including HTML views, PDF and ePub downloads, according to the available data) and Abstracts Views on Vision4Press platform.
Data correspond to usage on the plateform after 2015. The current usage metrics is available 48-96 hours after online publication and is updated daily on week days.
Initial download of the metrics may take a while.